Everyone wants their application to be fast and perform better than others. The main step in improving it is understanding all its operations. You have to concentrate on application logs to get a better picture of its activity.
How do you approach it? We will tell you more about the specifics of Java application logs. Keep reading and learn how to monitor them.
What is a Java Application Log?
First, you need to understand the concept of application log. It is a record of events that happen during the execution of a Java application. Logging is essential for
- Debugging;
- Monitoring;
- Maintaining software applications.
It gives you details about error handling and user interactions.
Java apps use various frameworks to capture and store records in different formats. They usually rely on databases or cloud-based systems. It makes them accessible for analysis and troubleshooting.
What are the main types of application logs?
Error
These logs capture errors and exceptions that happen during application execution. They help you diagnose and fix issues by providing stack traces and error messages. They often include details, like
- Class;
- Method;
- Line number.
It might be hard to identify the root cause of failures without it.
Debug
Debug ones have detailed information about your app’s internal processes. It includes
- Variable values;
- Method execution;
- Flow control.
You can use them during development and troubleshooting. They help you understand how the application processes data. So, it’s easier to identify bugs and unexpected behavior.
Info
These records provide general information about application operations, like
- Startup messages;
- User actions;
- Process milestones.
They help track its behavior without overwhelming the files. It’s especially useful for understanding how users interact with your application and monitoring system health.
Warning
Warnings indicate potential issues that may not cause immediate failure. However, they could lead to problems in the future. They help in preemptive debugging and maintenance.
For example, it might show that a configuration file is missing but the application is using a default value instead.
Audit
Audit logs track access events and system modifications. They are necessary for security and developer collaboration. It allows you to review actions taken within the application. They typically include details, like
- Timestamps;
- User IDs;
- IP addresses;
- Nature of the action.
Performance
These ones capture performance-related data, including
- Response times;
- Memory usage;
- Execution duration.
For instance, they can reveal bottlenecks and inefficient code. It helps you in optimizing application efficiency and resource management.
Why Do You Need Log Monitoring?
Java applications play a big role in many business operations. You already know about their events classes. Now, you’re probably wondering why it’s so important to monitor Java application logs.
So, here are some reasons to put your effort into this activity.
Better Application Performance
Log monitoring helps you determine operational bottlenecks and memory leaks. By analyzing them, you can optimize the app’s performance before users experience significant slowdowns.
Monitoring also helps you track how different system components interact. It gives you a full picture of the efficiency of your application. You can diagnose issues, like high response times or thread contention, and handle them instantly.
Early Detection of Errors and Bugs
Applications often face unexpected problems, like
- Exceptions;
- Runtime errors;
- Failed database connections, etc.
Event monitoring provides real-time details about errors. It lets you recognize and fix problems before they escalate into major failures.
As you already know, logs contain important debugging information. It can reduce the time needed to find the root cause of a failure a lot.
Automated alerting systems can notify you about any anomaly immediately. So, you can resolve it faster and minimize downtime.
Security Improvements
Different suspicious activities often leave traces in application records. So, constant monitoring will help you detect and handle potential security risks.
By examining them, you can recognize patterns that indicate attacks, like
- Brute-force login attempts;
- Unusual API calls;
- Unauthorized database access.
Plus, compliance regulations require organizations to maintain logs for auditing purposes. So, this activity is an essential part of regulatory adherence.
Resource Optimization
Log analysis can also help you indicate inefficient resource utilization. For example, you might recognize excessive CPU or memory consumption. That way, you can optimize these areas and reduce infrastructure costs.
These records give you details about resource consumption. It helps you fine-tune configurations and eliminate waste. It will not only lower operational costs but also enhance application responsiveness and stability.
Integration with DevOps
Modern log monitoring tools integrate with DevOps workflows. This enables
- Automated alerts;
- Live dashboards;
- Cooperation between development and operations teams.
This simplifies incident response efforts. You can notice potential issues early by incorporating monitoring into CI/CD pipelines. It prevents them from reaching production.
Steps of Java Application Log Monitoring
Proper monitoring is essential to maintain your systems stable and secure. You can diagnose issues faster and optimize their performance.
Which steps should you take to monitor Java application logs?
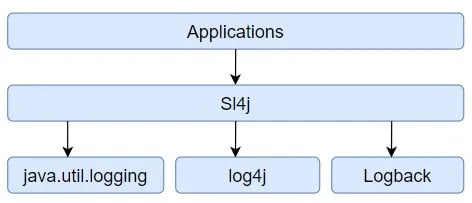
Enable Logging in the App
First, you have to enable logging and configure it properly within the app. You can use frameworks, like
- SLF4J;
- Log4j;
- java.util.logging.
They will capture application events systematically.
Next, you need to define the appropriate levels. That way, you’ll get essential info without overwhelming storage with excessive details.
Centralize Log Collection
Next, you have to centralize records in a unified location instead of keeping them on different servers or components. You can achieve this centralization with tools like
- ELK Stack;
- Graylog;
- Splunk.
They facilitate log aggregation and visualization.
Plus, you should implement rotation and archival mechanisms to prevent excessive file growth.
Use Formatting and Standardization
You have to structure your logging for efficient parsing and analysis. We recommend you use formats like JSON or XML to guarantee consistency.
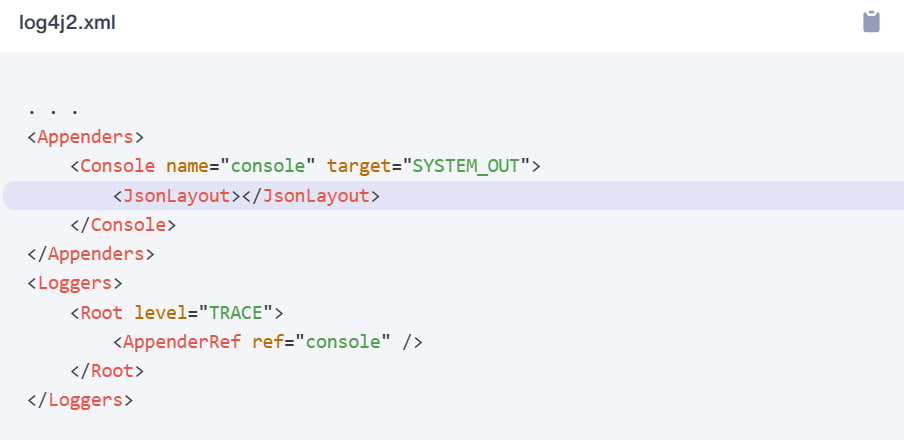
Each entry should include basic metadata:
- Timestamps;
- Log levels;
- Unique request IDs;
- Relevant contextual data.
A standardized format will simplify log ingestion into analysis tools. It will improve the overall observability of system events.
Define and Configure Alerts
It is not enough just to collect the logs. You also have to set up alerts for critical issues.
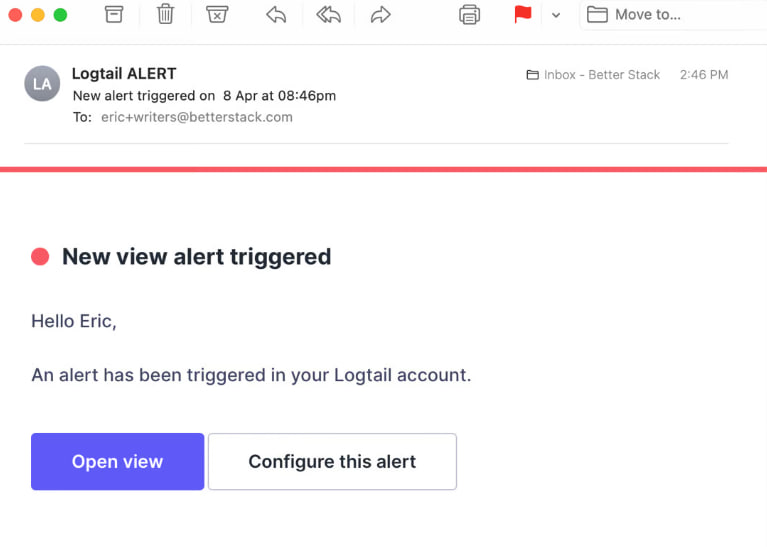
You need to define key error patterns. Then, configure alerts based on thresholds for performance degradation or unexpected failures. It will help you react faster.
You can integrate monitoring tools with log management systems to trigger automated notifications though
- Email;
- Slack;
- SMS, etc.
A good configuration of an alerting system will prevent small issues from escalating into big outages. It guarantees that the right personnel is informed in time.
Issue Diagnosis
As you already know, logs are an important resource for troubleshooting and root cause analysis. You can use the analysis tools to search and filter them. It helps you identify patterns and the source of application failures.
Root cause analysis involves tracing events on different system layers. That way, you can find dependencies and interactions that led to the problem.
Plus, you might use AI-powered analysis solutions to detect hidden patterns. They will give you insights into potential future failures before they happen.
Optimize Storage and Retention
Also, you should establish policies for storage and retention. You have to define a retention period depending on your business requirements and compliance obligations. It will prevent unnecessary storage costs. Plus, all the relevant historical data will remain available for analysis.
For instance, you might use cloud-based storage solutions. They allow you to store large volumes of logs securely.
Also, try to purge outdated events regularly. It will help you improve system performance and maintain an organized logging infrastructure.
Monitoring Tools
It’s evident that a proper Java log monitoring process is essential for better app performance and resource distribution. You already know the steps of this activity. So, the last thing we want to cover is the tools you can use.
Graylog
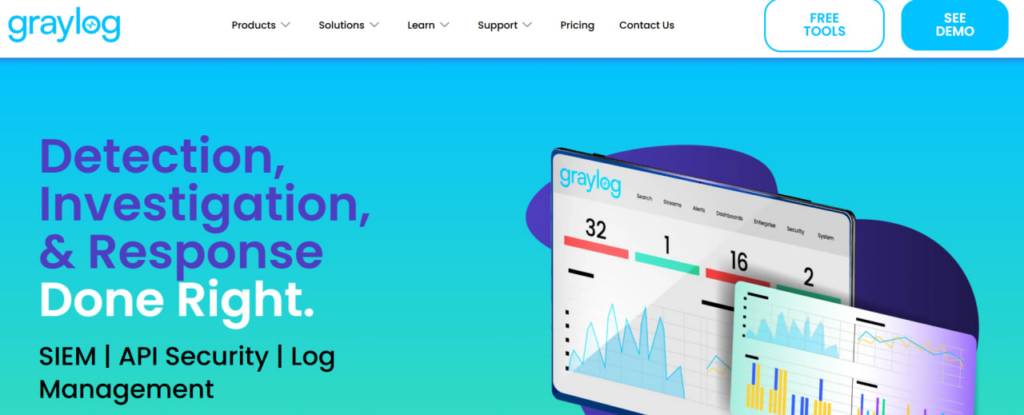
Our first suggestion is Graylog. It’s an open-source log management platform.
It can offer you unlimited log collection. So, no more guessing which ones to keep. You can capture everything and confirm you have the data you need when you need it.
Also, it has an intuitive viewer. So, you can investigate issues quickly and share insights with the right stakeholders.
Plus it offers an intelligent search functionality. You can easily build requests and conduct analysis to pinpoint
- Security threats;
- System outages;
- Operational inefficiencies.
You can configure alerts to distinguish routine activity from potential threats.
Splunk
The next alternative you might consider is Splunk. It has an observability platform for codeless troubleshooting. You can integrate logs with real-time metrics and traces to quickly diagnose and resolve issues.
It lets you unify all the data to reduce operational overhead and improve collaboration.
Also, you can analyze information with minimal effort. Splunk provides pre-built dashboards and filters that require no coding. You can also create custom dashboards with log-based visualizations.
Plus, it has advanced search and reporting functionalities. You can optimize storage by archiving unused records in third-party solutions.
Logstash
The last solution we want to highlight is Logstash. It is a part of the ELK Stack platform. It’s an open-source data processing tool that lets you gather info from different sources.
It supports numerous input types. After ingestion, you can use its powerful transformation capabilities. Some of the main filters it offers are
- Grok pattern matching;
- Geo-IP decoding;
- Sensitive data handling;
- Schema standardization.
Logstash is highly extensible. It has over 200 plugins that you can mix and match to create customized pipelines.
Plus, it includes built-in monitoring tools and a pipeline viewer. So, you can see all the details about performance metrics and potential bottlenecks.
Conclusion
The operational efficiency of Java applications is essential for proper performance and good UX. You need to put some effort into log evaluation. It will help you detect any issues early and improve the resource usage.
You have to standardize the formatting and configure the alerts to monitor Java application logs properly. Also, consider using the tools we described to simplify all these processes.
Hope that you found our guide useful!
