
Monitoring key performance metrics in Linux servers helps ensure system stability, manage resources efficiently, and identify performance issues. The monitoring agent collects data on CPU usage, memory performance, disk activity, network traffic, process activity, system workload, and user sessions.
The agent uses system commands such as sar, mpstat, iostat, netstat, and ps to gather real-time statistics. These metrics provide administrators with detailed information to detect slowdowns, optimize system performance, and prevent resource constraints.
Below is a breakdown of the key performance metrics collected.
Linux Server Performance Monitoring
Monitor all key performance metrics of your Linux server from a single console. A heat map analysis provides a summary of server status and performance trends over the past seven days, helping identify potential issues quickly.
Click the icon to access the Performance Report, which includes metrics such as CPU usage, memory allocation, and disk utilization. Performance data for specific time periods can be viewed by selecting the desired range from the drop-down menu in the top right corner. Reports can be exported as CSV/PDF or shared via email for further analysis.
Key Performance Metrics
The agent monitors multiple parameters, including:
- CPU Utilization;
- Multi-CPU Performance;
- Memory Usage;
- Disk Activity;
- Network Performance;
- Process Activity;
- System Workload;
- User Sessions.
Each of these categories offers detailed performance, helping system administrators identify bottlenecks and optimize resources.
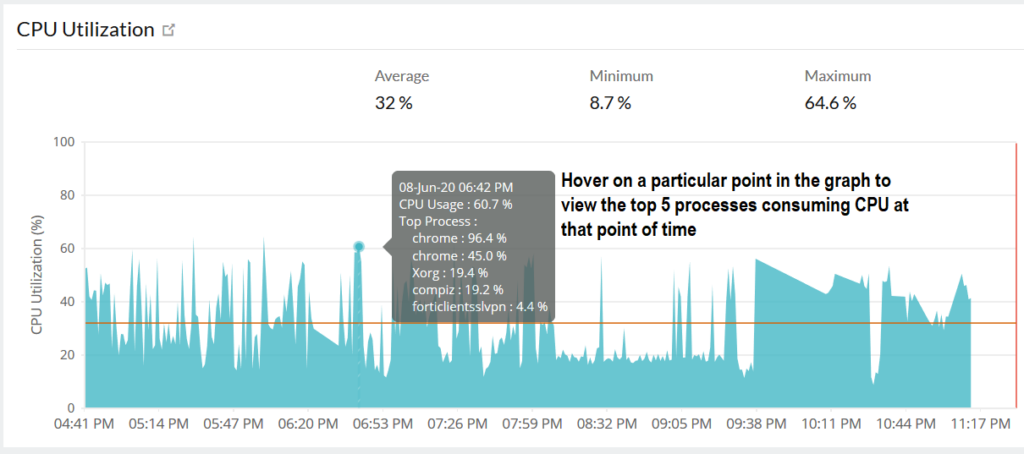
CPU Metrics
The monitoring agent utilizes the sar -urWqR 1 command to evaluate system counters over a one-second interval. The collected statistics are averaged across all CPUs on the system.
- % USR: The percentage of CPU time spent executing user-mode applications and subsystems;
- % SYS: The percentage of CPU time utilized by the kernel for processing system calls;
- % WIO: The proportion of time a runnable process spends waiting for an I/O operation to complete;
- % Total: The cumulative percentage of user, system, and wait I/O time;
- Run Queue Length: The percentage of time during which one or more processes or services are waiting for CPU access.
Multi-CPU Performance
The monitoring agent utilizes the sar and mpstat utilities on a Linux system to gather performance metrics from multi-CPU environments. It computes the average statistics for each CPU using the sar -x SELF -I SUM -P ALL -wu 1 command, which evaluates system counters over a one-second interval. The collected data provides insights for both the entire system and individual CPUs.
Key metrics include:
- User %: The proportion of CPU time utilized by user-mode processes;
- System %: The percentage of CPU resources dedicated to executing kernel processes;
- Wait I/O %: The fraction of time a runnable process spends waiting for an I/O operation to complete;
- SMTX: The count of read or write locks that a thread failed to acquire on the first attempt, as reported by the mpstat command;
- XCAL: The number of interprocessor cross-calls, where one processor signals another to perform a task. These are commonly used for maintaining virtual memory consistency, and heavy file system activity (such as NFS) can increase cross-call frequency;
- Interrupts: The total number of CPU interrupts processed;
- Total %: The combined percentage of User %, System %, and Wait I/O % utilization.
Memory Utilization
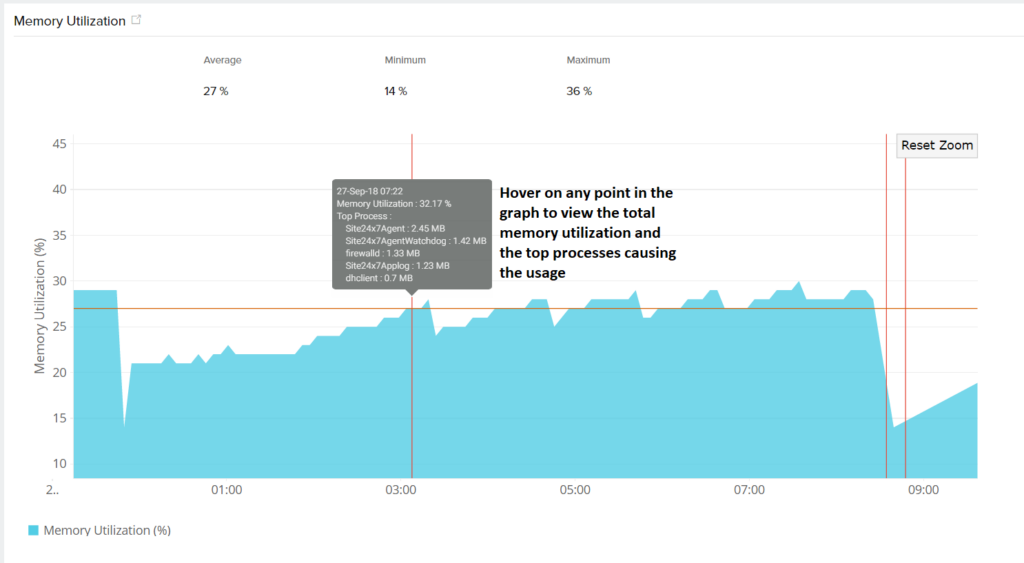
The monitoring agent retrieves the Free Memory metric using the free command on a Linux system. Additional memory-related metrics are collected with the sar -urWqR 1 command, which evaluates system counters over a one-second interval. The reported statistics represent system-wide memory performance.
- Free Memory: The amount of physical memory available for the operating system, system libraries, and applications;
- Cache Hit Rate: The frequency at which the system accesses data from the CPU cache instead of main memory;
- PageOut per Second: The rate at which memory pages are written to disk;
- PageIn per Second: The rate at which memory pages are read from or written to disk;
- PageFree per Second: The number of memory pages released per second;
- PageScan per Second: The average number of memory pages scanned per second;
- Free Swap: The percentage of total swap space that is currently available.
Disk Performance
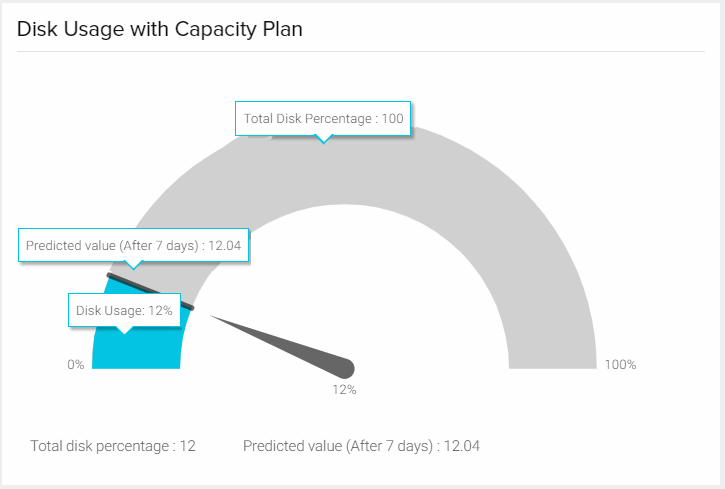
The monitoring agent collects file system statistics for each mounted file system using the df -lk command. Disk performance metrics, such as % busy, reads per second, and writes per second, are gathered per disk and analyzed across polling intervals using the iostat -d -x 1 2 command.
- Disk Name: Identifies each disk on the system;
- Usage (% Busy): The percentage of time the disk is actively processing read or write requests;
- Throughput (Blk/s): The number of read and write operations performed on the disk per second;
- Read/Writes per Second: The average volume of data transferred to or from the disk during read and write operations;
- Average Queue Length: The number of processes waiting for disk access;
- Average Service Time: The average time, in milliseconds, required to complete a disk request;
- Average Wait Time: The average time, in milliseconds, a transaction spends in the queue, directly influenced by queue length.
Network Performance
The monitoring agent utilizes the netstat -s command to obtain the total number of TCP retransmissions across all network interfaces. Additional network performance metrics, such as kbps, errors, and collisions, are averaged per interface using the sar -n DEV -n EDEV 1 command, which evaluates system counters over a one-second interval.
Inbound kbps represents the rate at which data is received through a specific network adapter, measured in kilobytes per second, while outbound kbps measures the rate at which data is transmitted. Inbound errors refer to incoming packets that contain errors, making them undeliverable to higher-layer protocols. Similarly, outbound errors are outgoing packets that fail to transmit due to transmission issues. Collisions occur when multiple network nodes transmit data at the same time, leading to signal conflicts. Lastly, TCP retransmits indicate the total number of packets that had to be resent due to failed transmission across network interfaces.
Process Activity
The monitoring agent utilizes the ps -eo command to retrieve detailed process information from a Linux system. By default, it collects data on the top 20 processes, sorting them based on the highest CPU usage.
- PID: Unique identifier assigned to a specific process;
- PPID: Identifier of the parent process that spawned the current process;
- UID: User ID associated with the process owner;
- GID: Group ID associated with the process owner;
- Memory Consumed: Total memory allocated to the process;
- RSS (Resident Set Size): Amount of physical memory actively used by the process;
- CPU % Utilization: Percentage of CPU resources consumed by the process;
- Memory % Utilization: Proportion of physical memory allocated to the process;
- Process Start Time: Timestamp indicating when the process was initiated;
- Process Run Time: Duration for which the process has been executing;
- Running Processes: Total number of active processes currently executing;
- Blocked Processes: Count of processes that are currently waiting for resources;
- Waiting Processes: Number of processes queued for CPU execution;
- Execs per Second: Rate at which system calls are executed per second;
- Process Creation Rate: Number of new processes generated within a specific time frame.
Workload Analysis
Workload analysis is conducted using the ps utility, which helps identify the processes consuming the most system resources. The monitoring agent measures workload in several ways. Workload by process evaluates the system demand created by running processes, including both network-related and local services. Workload by user tracks system usage based on logged-in user IDs, while workload by group assesses resource consumption at the group level.
To highlight the most resource-intensive processes, the system identifies the top 10 workload by process, listing the ten processes that use the most CPU power. Similarly, the top 10 workload by user ranks the highest CPU-consuming processes based on user ID. The top 10 workload by group provides a breakdown of the processes consuming the most CPU resources according to group ID. This analysis helps in understanding system performance and identifying potential resource bottlenecks.
User Sessions
The monitoring agent gathers user session data by executing specific system commands. The ps -eo command retrieves detailed process information, while the last | head 10 command displays the login history of the ten most recent users. Additionally, the who command lists all currently logged-in users.
The collected user metrics include login history, which tracks how frequently a user logs into the system within a 30-minute period. Another key metric is sessions, which indicates the number of active sessions or distinct users logged in during the same timeframe. These metrics help monitor system access and user activity efficiently.
Conclusion
Tracking performance metrics in Linux servers helps administrators manage resources effectively and address performance issues. By monitoring CPU usage, memory allocation, disk activity, network performance, process execution, system workload, and user sessions, potential bottlenecks can be identified and resolved before they impact operations.
The monitoring agent collects real-time data using system commands like sar, mpstat, iostat, netstat, and ps, providing detailed insights into system activity. Regular monitoring helps optimize resource allocation, prevent slowdowns, and maintain system stability.
