MySQL is a widely used relational database management system known for its reliability and performance, making it a key component for web, mobile, and cloud applications. As the foundation of many modern applications, ensuring optimal MySQL performance is crucial for maintaining smooth user experiences and operational efficiency. Monitoring MySQL performance helps identify potential issues, optimize database queries, and ensure high availability.
MySQL Performance Overview
MySQL is widely used in web, mobile, desktop, and cloud applications due to its speed and reliability. From its inception, MySQL has been designed as a high-performance database system.
Key Aspects of MySQL
The MySQL Reference Manual defines it as a multi-user, multi-threaded open-source relational database management system (RDBMS) known for its speed and stability. Launched in 1995, MySQL is available in two versions: MySQL Community Server (free) and MySQL Enterprise Edition (commercial).
MySQL offers a flexible architecture that supports an open-source, multi-threaded design with a pluggable storage engine. It is compatible with ANSI SQL standards, ensuring broad usability across different database applications. The system includes built-in replication and high-availability features, such as global transaction IDs and sharding, which enhance scalability and reliability. MySQL also supports online transaction processing (OLTP) and ensures data integrity through ACID compliance, referential integrity, and row-level locking. Additionally, it provides various security and performance optimization mechanisms to maintain efficient and secure database operations.
MySQL Features That Influence Performance

Compared to other relational databases like PostgreSQL, MySQL offers a more lightweight feature set, contributing to its speed and reliability. Key technical specifications affecting performance include:
- Resource groups for thread management and resource allocation;
- Partitioning for data distribution;
- Optimization for high concurrency and read-only workloads;
- SSD optimization;
- Support for multiple index types (B-tree, R-tree, hash, full-text);
- Server-side thread pooling;
- Connection thread caching;
- Diagnostics and SQL tracing tools;
- Performance schema and sys schema for monitoring.
These features help maintain MySQL’s reputation as a fast and efficient database, even as other RDBMS options improve in performance benchmarks.
Why Monitor MySQL Performance?
A database is a foundational component of any application, influencing the efficiency and reliability of everything built on top of it. Ensuring optimal MySQL performance is essential for maintaining a smooth user experience and preventing potential issues.
Proactive monitoring allows for early detection and resolution of performance bottlenecks before they impact users. Beyond troubleshooting, database monitoring also enables you to:
- Enhance efficiency by identifying and optimizing slow queries;
- Assess the impact of changes, such as schema modifications, data migrations, or feature rollouts;
- Allocate resources effectively through informed scaling decisions;
- Strengthen security by detecting vulnerabilities and implementing necessary protections;
- Improve user experience by uncovering areas for optimization.
Monitoring MySQL performance goes beyond the database, impacting the whole stability and efficacy of an application or website.
Optimizing MySQL Performance: Key Metrics to Monitor
Monitoring key MySQL performance metrics helps maintain efficiency and prevent slowdowns. Here are the most important indicators:
- Query Execution Time – Measures how long queries take to run. Slow queries often indicate inefficient indexing or resource limitations;
- Database Activity Levels – Tracks read and write operations to assess workload. High activity can signal performance issues;
- Memory Usage – Ensures MySQL is using RAM efficiently. Excessive usage can cause slowdowns due to swapping between RAM and disk;
- Disk I/O – Monitors read/write operations. High disk activity can slow performance, especially on HDDs;
- Replication Lag – Measures delay between primary and replica databases. Ensures data consistency and helps detect network issues;
- Active Connections – Tracks concurrent connections. Too many can overload the server and slow performance;
- Lock Contention – Identifies table and row locks during transactions. Excessive locking can delay queries and reduce efficiency.
Interpreting MySQL Performance Metrics for Optimization
Effectively analyzing MySQL performance metrics is essential for maintaining a fast and reliable database. This involves understanding key indicators, identifying bottlenecks, and using diagnostic tools to optimize performance. Here’s how to approach MySQL performance analysis:
Understanding Key Metrics
Interpreting performance metrics helps pinpoint inefficiencies and potential issues:
- Query Execution Time – Slow queries may indicate inefficient indexing, poorly structured queries, or server overload;
- Database Traffic – High traffic can signal efficient processing, but if latency increases, it may indicate an overburdened system;
- Memory Utilization – Consistently high memory usage suggests insufficient RAM or misconfigured query caching;
- Disk I/O Activity – Excessive read/write operations may require query optimization or storage upgrades;
- Replication Delay – Lag between primary and replica databases can indicate network latency or inefficient replication setup;
- Active Connections – A surge in connections may necessitate load balancing or connection pooling to manage demand;
- Lock Contention – Frequent locks can slow performance and require transaction optimization.
Identifying Bottlenecks
Performance bottlenecks hinder database efficiency. By analyzing metrics, you can determine where issues originate. For example:
- High CPU usage with slow queries suggests complex queries are overloading the processor;
- Increased disk I/O alongside slow response times may indicate storage limitations;
- Consistently maxed-out memory could point to inefficient caching or insufficient hardware resources.
Query Profiling
Beyond monitoring general metrics, query profiling offers a more granular analysis. Tools like EXPLAIN help visualize execution plans, identifying inefficiencies such as full table scans or missing indexes.
Analyzing Slow Query Logs
Slow query logs highlight queries that exceed expected execution times. Reviewing these logs helps identify performance bottlenecks, such as suboptimal indexing or inefficient query structures.
Proactive Performance Monitoring
Early detection of issues prevents disruptions. Automated monitoring tools can trigger alerts for abnormal spikes in CPU, memory, or disk activity, allowing for rapid intervention before performance deteriorates.
Trend Analysis for Future Optimization
Long-term trend analysis helps predict and prevent issues before they arise. By examining historical data, patterns such as peak usage times or growing data volumes can inform infrastructure scaling and performance tuning strategies.
MySQL Performance Monitoring Tools
MySQL performance may be monitored using a variety of tools, including built-in utilities and complex third-party solutions. These tools assist database administrators (DBAs) in maintaining peak performance by offering insight into important metrics and recognizing potential problems.
Built-in MySQL Tools
MySQL provides several built-in tools for basic performance monitoring and management:
- mysqladmin: A command-line tool used for administrative tasks such as checking server status, monitoring uptime, and reviewing system variables. It offers quick insights into MySQL server health and performance;
- MySQL Workbench: A graphical user interface tool that provides comprehensive database design, SQL development, and server administration capabilities. It is particularly useful for managing MySQL databases with an intuitive and accessible interface.
Third-Party Monitoring Tools
Third-party tools offer more advanced features and greater flexibility than built-in tools, especially for larger or more complex MySQL deployments. These solutions provide in-depth monitoring capabilities and scalability to meet evolving needs.
An open-source platform designed for monitoring MySQL and other database systems. PMM provides extensive insights into database performance with features including:
- Query Analytics: Visualize and analyze query performance to identify slow queries and optimize them;
- System Metrics: Real-time monitoring of server metrics such as CPU, memory, and disk usage;
- Alerting and Dashboards: Customizable dashboards and alerts to monitor performance and receive notifications about potential issues;
- Security Features: SSL support and audit logs to ensure secure database operations;
- Integrated Performance Advisors: Automated suggestions for performance improvements based on collected data;
- Historical Data Analysis: Track trends over time to assist with capacity planning and forecasting;
- Scalability: Designed to scale for large and complex systems, enabling the management of multiple servers and databases.
Combining both built-in and third-party tools enables effective monitoring of MySQL performance, ensuring that issues are quickly identified and optimizations are implemented to maintain database efficiency.
Monitoring and Collecting MySQL Performance Metrics
The previous section outlined key performance metrics to monitor in a MySQL database. This section explores various methods and tools available for collecting the necessary data.
Server Status Variables
MySQL maintains internal counters known as server status variables, which provide insights into the database’s operations. The total number of these variables depends on the MySQL Server version in use.
These variables can be retrieved using the SHOW [GLOBAL | SESSION] STATUS statement. When using GLOBAL, the command returns aggregated values across all connections, while SESSION limits the values to the current connection.
To check the value of a specific server status variable, use the SHOW STATUS LIKE statement:
mysql> SHOW STATUS LIKE ‘%Com_select%’;
+—————+——-+
| Variable_name | Value |
+—————+——-+
| Com_select | 10 |
+—————+——-+
Several important server status variables include Questions, Queries, Com_insert, and Com_update. The full list of available variables can be found in the MySQL Server documentation corresponding to the specific version in use.
Performance Schema
The MySQL Performance Schema provides detailed monitoring of server execution at the query level. In MySQL Server versions that support it, this schema is available as a database named performance_schema, which contains multiple tables that can be queried using standard SELECT statements. Before querying the Performance Schema, it must be properly installed and enabled.
The performance_schema database organizes its tables based on the type of data they store, including current events, event histories and summaries, object instances, and configuration settings. To retrieve a list of all available tables in the Performance Schema, use the following command:
mysql> SELECT TABLE_NAME FROM INFORMATION_SCHEMA.TABLES
WHERE TABLE_SCHEMA = ‘performance_schema’;
+——————————————————+
| TABLE_NAME |
+——————————————————+
| accounts |
| cond_instances |
| data_lock_waits |
| data_locks |
| events_errors_summary_by_account_by_error |
| events_errors_summary_by_host_by_error |
| events_errors_summary_by_thread_by_error |
…
| table_handles |
| table_io_waits_summary_by_index_usage |
| table_io_waits_summary_by_table |
| table_lock_waits_summary_by_table |
| threads |
| user_defined_functions |
| user_variables_by_thread |
| users |
| variables_by_thread |
| variables_info |
+——————————————————+
103 rows in set (0.1040 sec)
Key performance statistics can be obtained by querying specific tables in the performance_schema database, such as events_statements_summary_by_digest.
The following query retrieves the statement with the longest execution time:
mysql> SELECT digest_text, avg_timer_wait
FROM performance_schema.events_statements_summary_by_digest
ORDER BY avg_timer_wait DESC
LIMIT 1;
+———————————————–+—————-+
| digest_text | avg_timer_wait |
+———————————————–+—————-+
| INSERT INTO `rental` VALUES (…) /* , … */ | 407201600000 |
+———————————————–+—————-+
1 row in set (0.0052 sec)
To simplify queries, performance_schema can be set as the current database using the USE performance_schema statement, eliminating the need to specify the schema name in queries.
Sys Schema
Querying the Performance Schema can become complex in more advanced use cases. To simplify this process, MySQL introduced the sys schema in version 5.7.7.
The sys schema includes views, stored procedures, and stored functions that provide a more accessible way to retrieve data from the performance_schema tables. This allows for easier performance analysis without the need for complex queries.
For example, the following query retrieves file I/O performance data grouped by host:
mysql> SELECT * FROM sys.host_summary_by_file_io;
+————+——-+————+
| host | ios | io_latency |
+————+——-+————+
| background | 12167 | 1.48 s |
| localhost | 1694 | 427.99 ms |
+————+——-+————+
2 rows in set (0.0049 sec)
How to Choose the Right MySQL Monitoring Tool
Selecting an effective MySQL monitoring tool requires careful evaluation of your needs, budget, and feature requirements. Here’s how to make the right choice:
Start by identifying your specific monitoring requirements. Determine whether you need basic performance tracking or advanced diagnostics like query profiling and anomaly detection. Budget considerations also play a role—decide whether an open-source solution meets your needs or if a commercial tool with premium features is necessary.
Evaluate key features such as real-time monitoring, automated alerts, and customization options. The ability to integrate with your existing tech stack is crucial for efficient implementation. Scalability should also be a priority; choose a tool that can adapt as your database infrastructure grows.
For a more detailed analysis, choose solutions that provide comprehensive insights, including distributed tracing for better visibility into performance issues. Testing and comparing multiple tools before making a final decision helps ensure you select the most suitable MySQL monitoring solution.
Best MySQL Monitoring Tools
Monitoring MySQL performance is essential for maintaining database efficiency and detecting potential issues early. Here are some of the top tools available for tracking MySQL performance and optimizing database operations.
Prometheus (open-source)

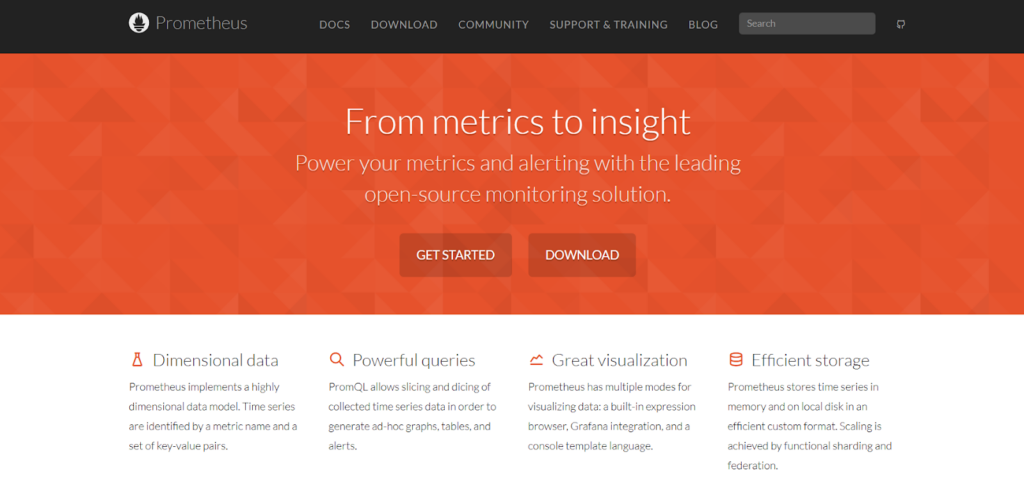
Prometheus is an open-source monitoring system that captures time-series data to track system and application performance. When used for MySQL, Prometheus enables the collection of metrics related to query performance and database deployment statistics.
To monitor MySQL with Prometheus, a MySQL exporter must be installed. This exporter collects key performance data from MySQL instances and relays it to a Prometheus server, where the information can be analyzed.
While Prometheus includes a basic visualization layer, it is commonly used with Grafana, a more advanced visualization tool that allows users to create custom charts and dashboards for monitoring MySQL performance.
Unlike some APM tools, Prometheus does not provide distributed tracing, meaning it lacks contextual tracking for MySQL queries. However, it still offers valuable insights into the performance of individual MySQL instances, making it a useful tool for database administrators looking to monitor system health and detect potential performance bottlenecks.
SigNoz MySQL monitoring (open-source)

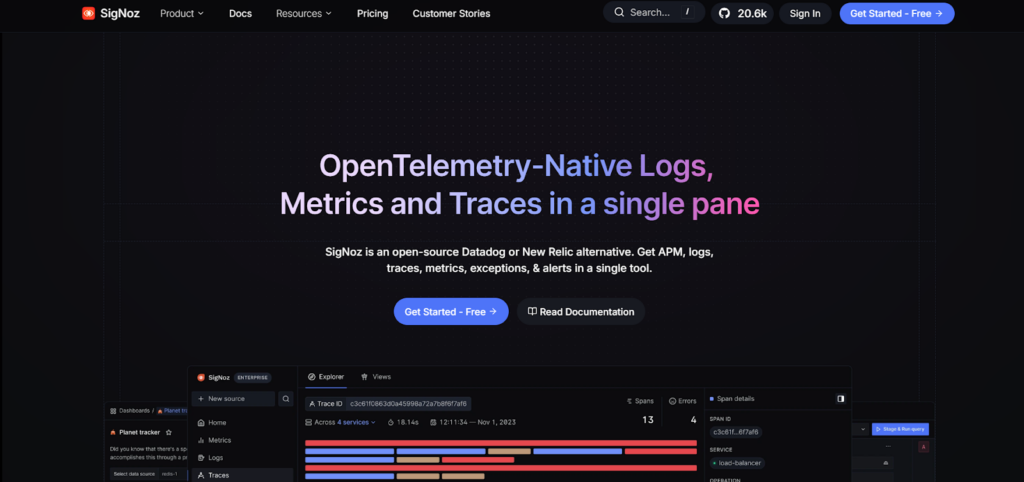
SigNoz is an open-source application performance monitoring (APM) tool that helps track and analyze MySQL database performance. It offers insights into both application and infrastructure metrics, making it especially useful for systems that use microservices and serverless architectures.
As modern applications often operate as distributed systems with multiple database instances handling queries from different services, SigNoz enables comprehensive monitoring of database calls across all services. This allows users to assess how MySQL queries impact overall system performance.
A key feature of SigNoz is its built-in metrics builder, which allows users to create customized dashboards for monitoring MySQL databases. Additionally, it provides insights into the health and performance of the host machines running MySQL, helping to ensure smooth database operations. Another valuable capability of SigNoz is distributed tracing, which offers complete visibility into how user requests are processed across the system.
Paessler PRTG Network Monitor

Paessler PRTG Network Monitor is a comprehensive IT infrastructure monitoring solution that includes MySQL monitoring as part of its feature set. It enables database administrators to track MySQL availability and performance, ensuring stable operations.
PRTG offers a pre-configured MySQL monitoring sensor, allowing users to quickly start monitoring key database metrics. This sensor automatically checks MySQL availability and execution times, providing essential insights into database performance.
Key features of PRTG Network Monitor for MySQL monitoring include:
- MySQL availability tracking to ensure the database remains online and responsive;
- Performance monitoring through automated requests that measure total query execution time;
- Dataset monitoring, allowing users to track specific data within MySQL databases;
- Alarm notifications, which alert users to database issues, enabling proactive resolution.
With its intuitive setup and real-time alerting, PRTG Network Monitor helps businesses maintain optimal MySQL performance while preventing downtime and inefficiencies.
MySQL Enterprise Monitor
MySQL Enterprise Edition includes MySQL Enterprise Monitor, a tool designed to enhance the performance and availability of MySQL instances. It provides real-time monitoring of database instances and host machines, alerting users to potential issues and helping them take corrective action before problems escalate.
This monitoring solution offers comprehensive visibility into MySQL performance, allowing database administrators to track critical metrics and optimize configurations. It helps ensure high availability by detecting inefficiencies, identifying slow queries, and monitoring resource usage.
Key features of MySQL Enterprise Monitor include:
- Cloud-based remote monitoring for managing MySQL instances from anywhere;
- Visual Query Analysis to help identify slow or inefficient queries;
- MySQL Cluster Monitoring helps oversee performance in MySQL clusters;
- Real-time Health & Availability Monitoring to detect and address performance bottlenecks;
- Easy setup and configuration, allowing users to implement monitoring without extensive technical expertise.
Solarwinds

SolarWinds is an IT management and observability platform that includes Database Performance Monitoring (DPM) for MySQL. This tool helps detect, diagnose, and resolve MySQL performance issues efficiently.
Getting started with SolarWinds DPM is straightforward, as it provides auto-discovery agents that automatically detect and install on MySQL systems. Once set up, DPM monitors a wide range of performance metrics, including database activity, CPU usage, running processes, and other system components.
Dynatrace

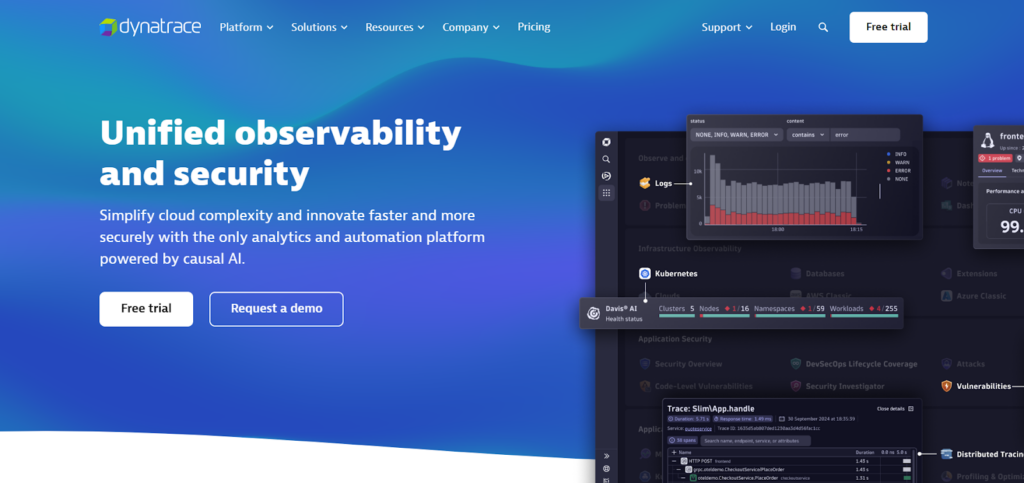
Dynatrace is a cloud-based monitoring solution that includes MySQL performance tracking as part of its platform. Its auto-detection agents identify MySQL databases and begin monitoring without requiring manual configuration.
One of Dynatrace’s key advantages is its ability to compare current MySQL performance with historical data, establishing a baseline for normal operations. This allows users to detect anomalies, identify trends, and optimize database performance over time.
Additionally, Dynatrace monitors MySQL performance from the application’s perspective, automatically detecting queries that process large amounts of data. This helps pinpoint inefficient queries and improve overall database efficiency, ensuring better responsiveness for applications that rely on MySQL.
Sematext

Sematext is an enterprise monitoring tool designed for IT systems and infrastructure management. It offers detailed dashboards for MySQL monitoring, allowing users to track key performance metrics and optimize database operations.
With Sematext, users can monitor availability, replication status, active connections, query rate, and other performance indicators. These insights help ensure MySQL databases remain stable, efficient, and responsive.
Datadog

Datadog is a comprehensive enterprise monitoring tool offering solutions such as Application Performance Monitoring (APM), infrastructure monitoring, and real-user monitoring. It provides detailed MySQL monitoring by continually collecting key statistics and metrics from your MySQL databases.
To start using Datadog, you need to install Datadog agents on your MySQL database servers. Once set up, you can monitor real-time performance and track historical trends using Datadog’s customizable dashboards. This helps ensure your MySQL databases perform optimally and any potential issues are detected early.
New Relic

New Relic is an application monitoring tool designed to track the performance of both applications and infrastructure. It offers a wide range of solutions, including application performance monitoring, infrastructure monitoring, and log management.
With New Relic’s dashboard, you can track critical MySQL performance metrics, such as uptime, connection count, memory usage, query speed, and storage performance. New Relic’s MySQL integration collects performance data from your MySQL databases and sends it to their platform for centralized monitoring, giving you deep insights into database health and performance.
ManageEngine Applications Manager

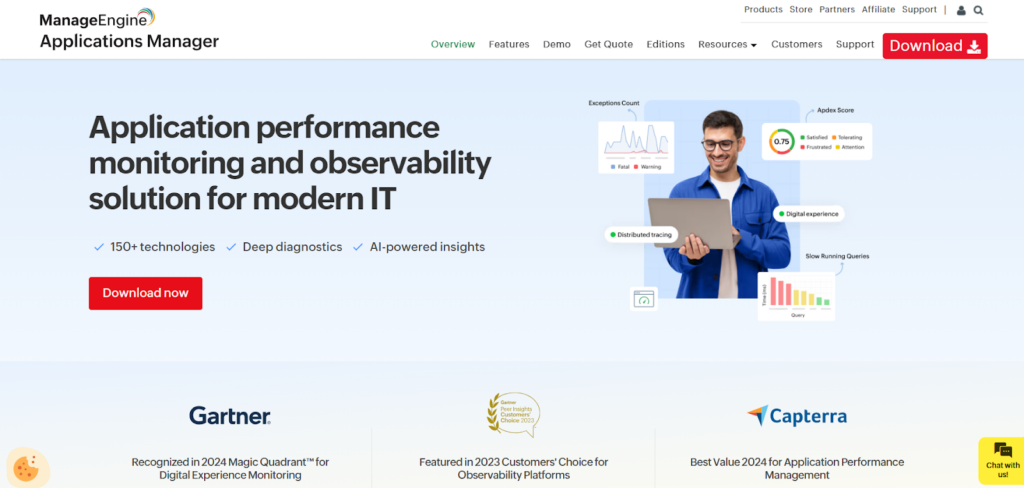
ManageEngine Applications Manager is a monitoring solution for IT systems, including MySQL databases. It provides comprehensive tools for tracking key MySQL performance metrics and sending notifications in case of any downtime or performance issues.
Conclusion
Monitoring MySQL database performance is crucial for ensuring application efficiency and reliability. By tracking important metrics like query execution time, memory usage, disk I/O, and active connections, database administrators can identify and fix issues before they impact users. Using the appropriate monitoring tools helps businesses improve performance, security, and availability. Whether using open-source tools like Prometheus and SigNoz or commercial options like MySQL Enterprise Monitor and Dynatrace, the choice depends on specific needs, budget, and scalability. Regular monitoring and performance optimization are necessary for stable database operations and the growth of modern applications.
