Monitoring PHP applications is essential for maintaining stable performance, preventing system slowdowns, and ensuring a smooth user experience. As PHP applications scale and user demands grow, tracking performance metrics becomes increasingly important. Monitoring tools not only help identify bottlenecks and inefficiencies but also support early detection of errors, slow queries, and resource overuse.
What Is PHP Monitoring?
PHP monitoring is essential for keeping an eye on the performance and stability of PHP applications. It helps detect potential issues such as high CPU usage, excessive memory load, slow response times, and execution errors, allowing for quick resolution before they impact users.
To stay updated, you can analyze event data using visualization features offered by monitoring platforms or configure real-time alerts through your chosen communication channels, including SMS, email, Slack, or integrated ticketing systems. This ensures you’re promptly notified of any critical issues as they arise.
The Importance of PHP Monitoring
PHP monitoring helps keep key applications running efficiently by allowing DevOps teams to detect and fix issues faster. It reduces the need for extensive analysis, saving time and costs while maintaining system stability.
Efficient Issue Detection and Debugging
Identifying performance issues early is critical for reducing Mean Time to Recovery (MTTR). PHP observability tools are critical in discovering and addressing issues at the early stages of the Software Development Lifecycle (SDLC), allowing for faster changes and better outcomes.
An effective PHP monitoring solution offers essential features such as:
- Detailed Call Stack Traces – Identify bottlenecks and simplify issue resolution;
- Automatic Business Transaction Mapping – Track the flow of essential operations;
- Dynamic Baselining – Set standard performance benchmarks to detect anomalies faster;
- Code-Level Analysis – Examine the code closely for precise and efficient troubleshooting.
These capabilities ensure consistent application performance, whether hosted on-site or in the cloud.
Performance Optimization for Better User Experience
PHP monitoring not only fixes issues but also improves overall performance, which is key for user satisfaction. It collects and analyzes data to identify slow areas and boost efficiency.
A key part of this process is scope analysis, which helps find affected users, slow transactions, and recurring issues. Fault isolation is also important, as it pinpoints whether network layers, endpoints, or servers are causing slowdowns, allowing teams to address specific problems.
Root cause analysis further supports long-term optimization by identifying defects, system changes, or misconfigurations that impact performance.
Enhancing Security Through PHP Monitoring
As PHP applications scale, they become more complex and potentially more vulnerable. PHP monitoring helps DevOps and security teams detect and address security threats, ensuring applications remain resilient against attacks.
A PHP monitoring system helps by:
- Identifying services and third-party libraries with known vulnerabilities;
- Mapping vulnerabilities to potential security risks;
- Tracking exposure to active attacks;
- Assisting in threat mitigation and system hardening.
Improving Availability and Uptime
High availability and sustained uptime are required for mission-critical PHP applications. PHP monitoring tools aid in meeting Service Level Agreements (SLAs) by spotting issues before they affect stability. To improve availability, set SLAs with specific performance targets, analyze the business impact of potential breaches, and include decision-makers in aligning plans and allocating resources for system reliability.
Picking the Best PHP Monitoring Tool
Choosing the best PHP monitoring solution requires a clear understanding of your application’s requirements and the available alternatives for optimizing your PHP monitoring approach. The ideal solution should meet essential performance and integration requirements to ensure smooth operation and valuable insights. Key features to consider include:
- Simple Installation across all components;
- Integration with DevOps pipelines to enhance workflows;
- Improved Development Experience for smoother coding and debugging;
- High Configurability to tailor APM features to your specific application needs;
- Clear Data Visualization for quick, actionable insights.
Additionally, factors like cost, PHP monitoring requirements, compatibility with existing processes and observability tools, and how the PHP applications are deployed and used should guide your decision when choosing the most suitable monitoring solution.
Top PHP Application Monitoring Tools
1. Dynatrace
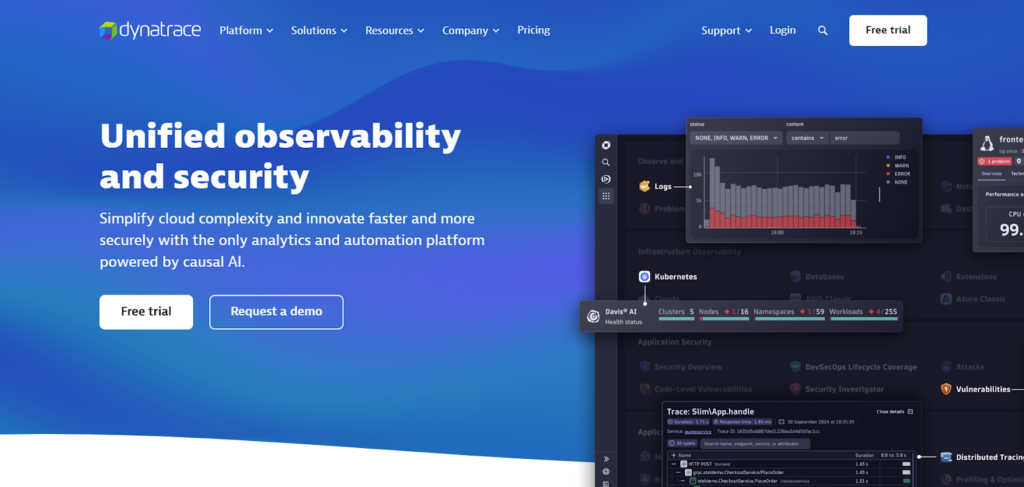
Dynatrace employs its OneAgent to monitor PHP applications thoroughly. It collects data on transactions, SQL queries, and code-level metrics, then displays everything on clear, easy-to-read dashboards. With support for platforms like WordPress, Joomla, Drupal, and Magento, it provides the detailed insights you need to optimize your online applications.
2. Datadog
To sustain SLAs and SLOs, Datadog’s PHP APM tools aid in performance optimization and issue resolution. It offers detailed maps for tracing PHP services and supports monitoring at the app, endpoint, and user levels with Trace Search and Analytics. Datadog’s smart alerting system detects unknown issues and integrates with third-party tools for efficient notifications. It supports frameworks like Laravel, Zend, and Symfony, and auto-instruments PHP libraries such as CURL, Guzzle, and PDO.
3. New Relic
New Relic offers robust PHP application performance monitoring, focusing on identifying and resolving performance issues. It tracks key transactions, monitors critical metrics, and displays real-time data through customizable dashboards. With features for query optimization and instant observability, New Relic supports efficient troubleshooting and system improvement.
4. Better Stack

Better Stack is a structured log management platform built on ClickHouse, enabling real-time data collection from PHP applications using a simple client library. Its efficient ClickHouse backend, user-friendly dark-mode UI, and built-in collaboration tools make debugging faster and more efficient.
Better Stack Logs integrates smoothly with Better Stack Uptime, providing a full observability solution with incident management features. One-click integration with Better Uptime allows instant alerts for errors or unusual activity, helping teams respond quickly to issues.
5. PHP Server Monitor
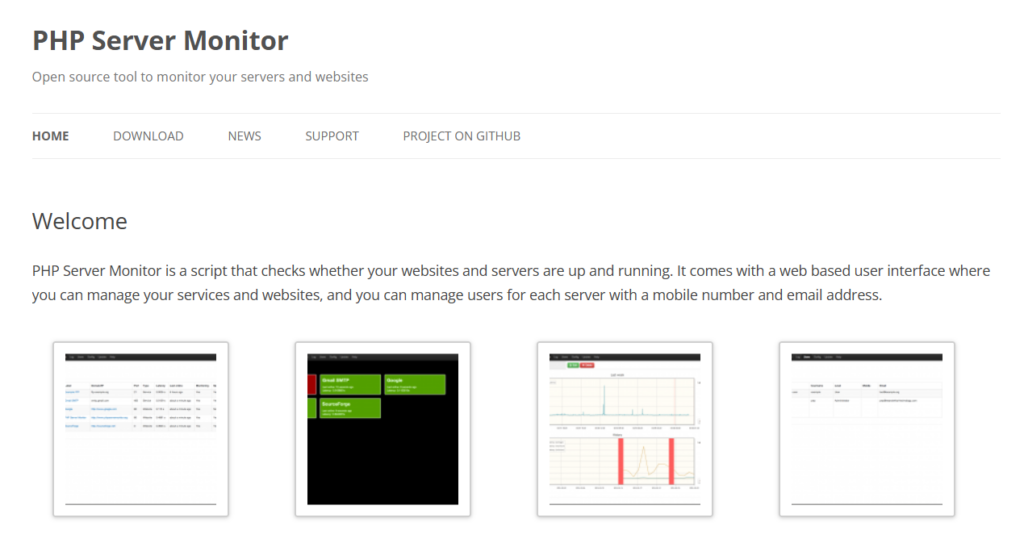
PHP Server Monitor is an open-source tool that checks server and website uptime. It offers a basic, web-based interface for managing servers and monitoring availability. The tool supports cronjob monitoring, basic log collection, and sends alerts via email, SMS, and Pushover notifications, making it a straightforward option for small-scale server monitoring.
6. Sentry.io
Originally designed for Python, Sentry.io now supports PHP, Laravel, and Symfony frameworks. Its PHP error monitoring identifies bottlenecks, tracks exceptions, and simplifies debugging. Sentry provides complete stack traces, contextual data, and intuitive filtering and grouping, enabling developers to detect and resolve issues quickly.
7. Atatus
Atatus is an APM solution that offers PHP performance monitoring and error tracking. It delivers insights into root cause issues, helps optimize application performance, and enhances user experience. Atatus identifies slow transactions, inefficient database queries, and problematic network calls while monitoring exceptions that impact end-users.
8. ManageEngine APM
ManageEngine enables PHP performance monitoring while tracking key user experience metrics like APDEX score, response time, throughput, and exceptions. It provides insights into database operations, including transaction response times, frequency of calls, and throughput details, helping identify slow operations. The PHP Performance Monitor Agent also highlights slow SQL queries, offering enhanced database-level visibility.
9. Instana
Instana offers end-to-end observability for PHP applications and infrastructure. It tracks metrics like average latency, error rate, and requests per second while capturing every call made through the application. This ensures complete traceability of potential errors. Instana automatically detects PHP components such as CGI and FPM and applies the correct monitoring sensors.
10. Stackify (Retrace)
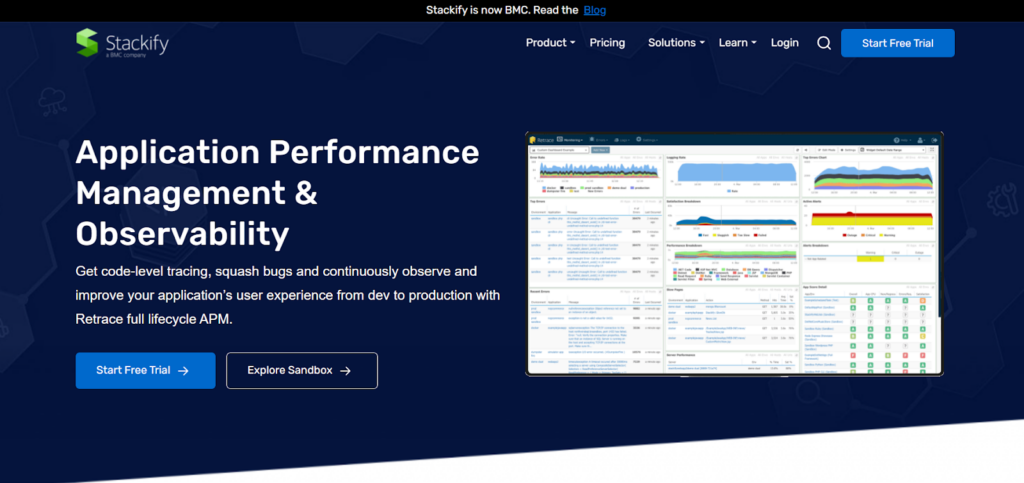
Retrace by Stackify is a code-level APM tool designed for continuous monitoring and testing of PHP applications. It tracks performance issues and generates summaries and reports, allowing developers to quickly address anomalies. Retrace monitors key metrics like error rates, average load times, requests per minute, APDEX, and an overall App Score, which combines multiple metrics into a single performance rating.
11. Raygun
Raygun delivers PHP performance and error monitoring for both web and mobile applications. It offers real-time insights into performance issues, tracks customer experience metrics, and monitors errors and crashes. With code-level diagnostics, Raygun helps identify the root causes of outages. When combined with Real User Monitoring (RUM) and crash reporting, it provides a full, client-focused observability solution.
12. Site24x7 APM Insights
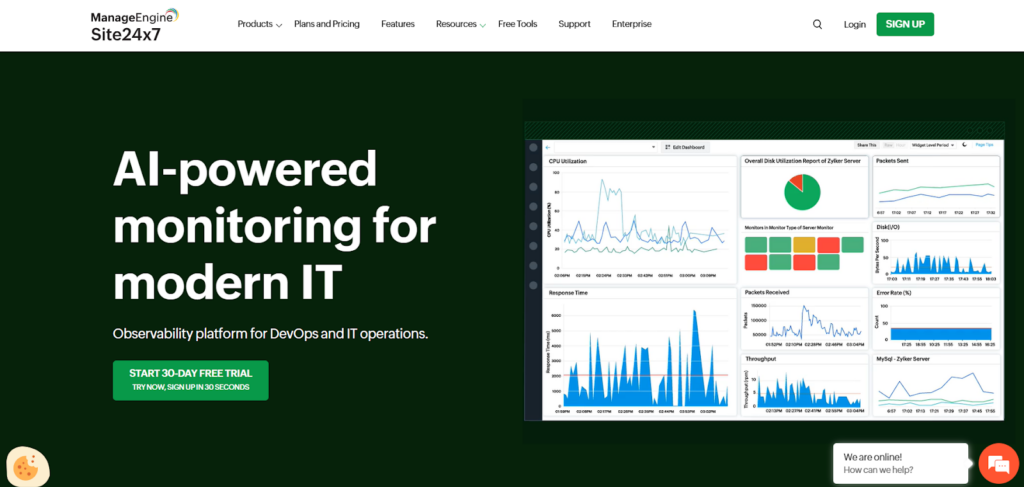
Site24x7 uses trace-based PHP performance monitoring to pinpoint slow methods and retrieve execution details. It visualizes trace data to show the sequence of invocations and highlights inefficient SQL queries. With both APM and Real User Monitoring (RUM) available, combining these tools provides a complete view of application performance.
13. AppOptics
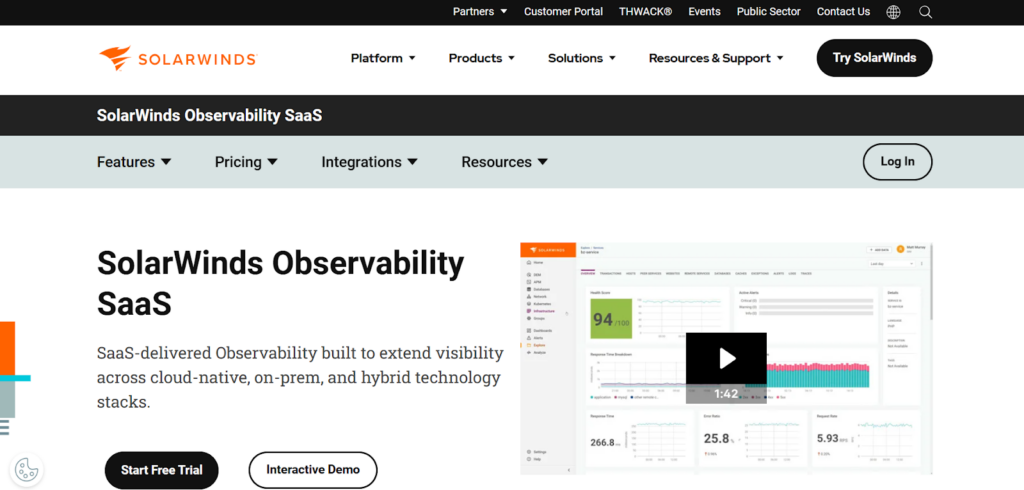
AppOptics by SolarWinds offers real-time monitoring for PHP applications, providing end-to-end observability across distributed systems. It tracks how remote calls, frameworks, and user-defined methods impact PHP performance and memory usage. AppOptics also detects performance bottlenecks, supports code-level analysis, and allows the creation of custom plugins for tailored monitoring needs.
Core PHP Performance Metrics
Reliable PHP performance monitoring is vital for identifying and fixing issues that degrade application efficiency. By reviewing key performance metrics—such as CPU usage, memory consumption, and response time—developers can pinpoint bottlenecks and adjust their code to ensure optimal performance.
CPU Usage
Excessive CPU usage signals that a PHP application is overexerting resources, leading to slower response times and potential performance bottlenecks. Continuous monitoring of CPU usage helps developers spot areas of high processing demand and refine their code for greater efficiency.
Analyzing CPU trends over time enables developers to locate code segments that consume excessive resources and apply targeted optimizations to improve overall application performance.
Memory Usage
Increased memory usage often stems from memory leaks, inefficient data handling, or caching issues. Memory leaks are common in PHP applications, occurring when allocated memory isn’t properly released, gradually depleting system resources.
If left unchecked, memory leaks can slow down applications, cause unexpected behavior, and lead to crashes. Regularly monitoring memory usage helps developers spot these issues early and apply fixes.
Response Time
Response time tracks the duration a PHP application takes to handle a user request, from receiving it to sending the response back to the browser. Monitoring this metric is important for keeping the user experience fast and responsive, as delays can frustrate users, reduce engagement, and lower conversion rates. Optimizing response time allows developers to improve interactions and increase user satisfaction.
Improve PHP Performance with Practical Caching Strategies
Caching is a simple yet effective way to improve PHP performance. By storing frequently used data or query results, PHP applications can reduce database strain and speed up page load times. This leads to a smoother and faster experience for users. Below are some practical caching methods that can help optimize your PHP applications:
OpCode Caching
OpCode caching saves precompiled PHP bytecode in memory, eliminating the need to repeatedly interpret PHP scripts. Starting from PHP 5.5, opcode caching is built-in and enabled by default, significantly improving application efficiency by storing compiled code for quicker execution.
Introduced in PHP 7.4, Opcache preloading allows PHP files to be loaded into the opcode cache during engine initialization, further optimizing performance. Additionally, PHP 8.1 introduced the Inheritance Cache feature, enhancing caching capabilities for complex applications.
Object Caching
Object caching stores frequently used objects in memory, reducing the need for repetitive and resource-intensive database queries. This approach leads to faster response times and improved overall performance.
Implementing object caching with solutions like Memcached or Redis enables features such as distributed caching, object serialization, and customizable expiration times. These tools offer flexible options to meet the specific needs of various PHP applications.
Page Caching
Page caching improves web application performance by saving the HTML output of a page, allowing it to be served directly from memory instead of regenerating it for every user request. This approach reduces server load and significantly improves response times, particularly for high-traffic pages.
A popular solution for page caching is Nginx FastCGI cache, which works alongside Nginx servers. It caches FastCGI application responses—such as those from PHP—directly in memory, cutting down the number of requests to the application server and accelerating response times.
Optimize Database Queries for Better Performance
Database queries can slow down web applications. Use these tactics to increase efficiency and reduce server load:
- Use Indexing: Indexing speeds up queries by mapping column values to rows, avoiding full-table scans. Index frequently queried columns to reduce processing time;
- Optimize Queries: Refine query structure with tuning, data normalization, caching, and table partitioning. Regularly analyze SQL queries to fix inefficiencies. Tools like Percona Monitoring and Management (PMM) help monitor and optimize databases;
- Implement Caching: Cache frequently used query results to reduce database load and speed up response times. Use methods like buffer cache, table cache, thread cache, and key cache for better scalability and faster data retrieval.
Conclusion
Consistent PHP performance monitoring is key to keeping applications efficient, stable, and secure. Tracking metrics like CPU usage, memory, and response times helps developers spot issues and improve performance. Using caching, optimizing database queries, and selecting the right tools can reduce downtime, improve user satisfaction, and support smoother development.
