PHP is one of the most widely used programming languages for web development, but ensuring its optimal performance requires more than just clean code. Performance testing is a crucial step to identify inefficiencies, bottlenecks, and potential errors that could affect the user experience. Without proper testing, web applications may suffer from slow load times, high resource consumption, or unexpected failures.
PHP Code Profilers
PHP code profilers help developers boost performance and detect issues in web applications. There are two main types: standard and tracing profilers. Standard profilers periodically capture stack traces, highlighting CPU usage, memory consumption, code execution time, and method call frequency. They’re ideal for spotting memory leaks and performance bottlenecks. Tracing profilers, designed for continuous use without slowing development, catch errors in real time. This allows developers to fix issues as they code, serving as an effective early-stage debugging tool.
Advantages of PHP Code Profilers:
- Resource Optimization: Profilers collect data on memory and CPU utilization, allowing developers to fine-tune apps for peak performance. This is critical since web applications rely on costly server resources;
- Error Detection: Tracing profilers support real-time debugging, allowing developers to find and correct faults during development, even while applications are in production;
- Expense-effective: Many PHP profilers are free to use, delivering significant insights at no additional expense;
- Performance Monitoring: Standard profilers assist in detecting hidden problems such as memory leaks, which can impact program performance over time.
Disadvantages of PHP Code Profilers:
- Server Overhead: Profilers can add extra load to servers, especially during active profiling sessions. However, this is usually not an issue since profiling is typically done in local development setups;
- Limited Production Use: While profiling in production is possible, it should be done carefully to avoid significant performance degradation. Profilers are primarily intended for development stages.
The usage of these profilers varies from Xdebug and Xhprof. While Xdebug and Xhprof are relatively simple to set up on a web server, some other profilers may require advanced technical skills. Additional PHP code profilers include Zend and Prefix. Prefix, developed by Stackify, is a free and lightweight profiling tool designed specifically for developers.
For a more in-depth understanding of continuous PHP performance monitoring and how it complements profiling tools, explore our detailed guide on best practices and tools for effective performance tracking.
Testing for Code Quality
PHPUnit is a widely used framework for testing PHP applications, enabling developers to create unit tests and view results in various formats. It offers features like testing classes, sets, or individual functions, using mock objects to simulate scenarios, and code coverage analysis to ensure thorough testing. It also enables generating test results in formats such as JUnit XML and TestDox for improved reporting and integration.
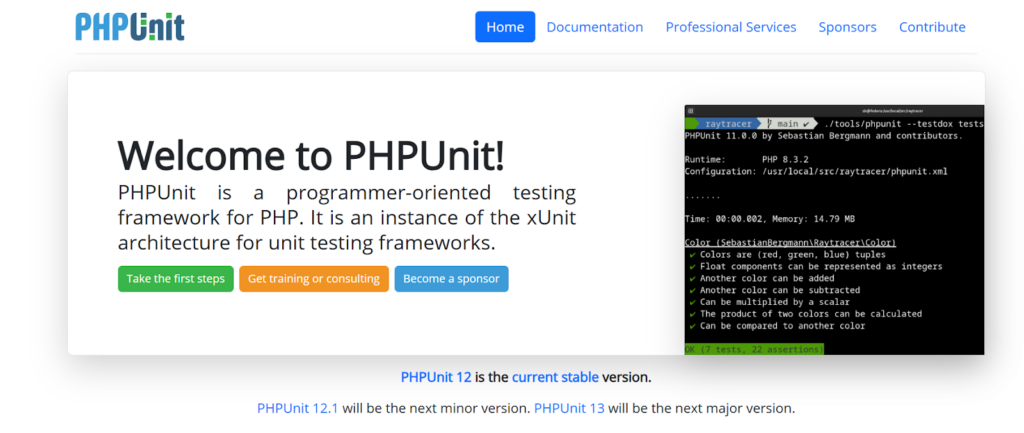
PHPUnit is especially valued for its effectiveness in consistency and scalability testing, making it an ideal choice for companies that are growing or anticipating significant expansion. Its flexibility and detailed reporting capabilities help developers maintain high code quality throughout the development lifecycle.
To further enhance your testing strategy and simulate real-world load scenarios, consider implementing a PHP performance test harness for more controlled and accurate performance evaluations.
PHP Application Performance Management (APM) Tools
Monitoring a web application’s behavior under various conditions is critical for discovering and improving underperforming components. Identifying which components of the program cause slowdowns enables engineers to enhance overall performance. PHP speed bottlenecks frequently occur during database queries and API requests, because the program must wait for these operations to complete before moving on to the next job. Tools like Retrace contribute significantly to performance monitoring by offering detailed information.
Using data collected by Retrace, developers can identify issues such as heavy server loads caused by multiple inserts and select queries. By evaluating these queries, they may identify the fundamental reasons and apply fixes, like as employing left joins in select queries, to improve application performance.
Retrace also enables developers to track which pages or requests are the most active and the average time taken to process them. This information helps identify specific pages, queries, or requests that require optimization to improve speed and efficiency.
APM tools offer in-depth profiling across servers, databases, logs, web requests, and PHP performance, helping developers quickly spot bottlenecks and focus on key optimizations. They also provide user-focused insights, tracking satisfaction, popular requests, and SQL query performance. Running continuously, APMs send real-time alerts for fast issue resolution.
While often priced per server, which can be costly for larger apps, some providers offer more affordable options. Despite the expense, their value in ensuring top performance and user satisfaction often justifies the cost.
Real User Monitoring (RUM) Tools
Real User Monitoring (RUM) is a performance tracking method that focuses on collecting data from actual users as they interact with a web application. By embedding a lightweight JavaScript snippet into web pages, RUM tools passively gather information in the background while users browse the site. This continuous monitoring provides valuable insights into user behavior, helping developers optimize website performance and enhance user experience.
One of RUM’s key responsibilities is to track which pages visitors visit and how long they stay on each one. This data is very essential for making strategic decisions, such as where to position adverts or critical material to increase visibility. RUM data may also assist in identifying possible bottlenecks and places where the user experience can be enhanced.

Google Analytics is a popular example of a simple RUM tool. However, there is continuous controversy about whether to utilize genuine user tracking or fake monitoring. RUM focuses on actual user activity, whereas synthetic monitoring tests application performance through simulated user interactions. The two techniques complement one another: synthetic monitoring is appropriate for proactive testing, whereas RUM gives real-world use information.
Advantages of RUM Tools:
- Real-World Insights: RUM tracks actual user interactions, providing data on page load times, error rates, and engagement;
- Detailed User Data: It collects information on user location, browser, ISP, device, and other factors affecting the experience;
- Business Impact Analysis: RUM links performance issues to business impact, helping developers isolate and fix problems faster;
- User Segmentation: It identifies user groups and behaviors, enabling targeted improvements;
- Performance Baselines: RUM sets benchmarks for metrics like load times and error rates to guide optimization and reduce drop-offs.
Disadvantages of RUM Tools:
- Data Overload: RUM generates vast amounts of data by tracking every user interaction. Without proper data management tools, analyzing this data can become overwhelming for development and DevOps teams;
- Limited Predictive Capability: Since RUM only tracks real user activity, it cannot test new features or changes before they go live. This makes it difficult to predict how updates will perform under different conditions;
- Low-Traffic Periods: During off-peak hours or in regions with fewer users, RUM provides less real-time data, which can limit its effectiveness in continuous performance monitoring;
- Root Cause Complexity: While RUM excels at identifying when and where performance issues occur, it may fall short in pinpointing the exact root cause unless combined with more advanced diagnostic tools.
RUM captures real user interactions, highlighting performance issues as they happen, while synthetic monitoring uses pre-scripted tests to predict potential problems. Combining both offers the best results—synthetic monitoring for proactive testing and RUM for real-time user insights.
RUM tools provide valuable data to help developers improve performance and user engagement. Though challenges like data overload and low-traffic gaps exist, pairing RUM with synthetic monitoring creates a cohesive, effective performance strategy.
Web Server Access Logs
To enable Retrace to effectively monitor a web application, essential details such as time, request path, status, and log event date must be recorded in the web server’s access logs. If these details are not currently captured, they can be configured within the web server’s settings. With this data, Retrace can analyze key metrics like requests per minute, average load time, and HTTP error occurrences, providing valuable insights into the web application’s performance.
Exception Tracking
PHP, similar to other programming languages, offers robust exception handling. Tracking exceptions is critical since they often halt system execution. However, when exceptions occur in the backend, such as within web services, they can be difficult to detect.
$file = “file-not-exists.php”;
if (!file_exists(“../app/models/”.$file)) {
throw new Exception(“{$file} was not found”);
}
Typically, these errors are recorded in the web server’s logs. However, developers may not always have direct access to these logs. This makes it essential to use an error-tracking tool that ensures exceptions are easily accessible to developers, helping them identify and address issues promptly.
Conclusion
PHP performance testing keeps web applications fast and reliable. Profilers, unit testing frameworks, APMs, and real-time user monitoring assist developers in identifying bottlenecks, correcting mistakes, and enhancing code quality. Each tool has a purpose, ranging from identifying memory leaks to tracking user activities and analyzing server logs. Though some tools may add costs or overhead, their long-term benefits in preventing issues, improving performance, and supporting scaling make them a valuable investment.
