Business intelligence (BI) tools help organizations analyze data, generate reports, and improve decision-making. With various options available, businesses must consider factors such as ease of use, automation features, integration capabilities, and data management. Some tools are designed for large enterprises handling complex datasets, while others cater to smaller teams needing simple reporting and visualization.
What is a BI Tool?
Business intelligence (BI) tools are software applications designed to gather, process, and analyze large volumes of structured and unstructured data from various internal and external sources. These sources may include documents, emails, images, videos, books, social media posts, and other digital files. BI tools retrieve and organize this data using queries, and then present insights in user-friendly formats such as dashboards, reports, charts, and graphs.
These tools offer a range of capabilities, including data mining, visualization, performance management, analytics, reporting, text mining, and predictive analysis.
Modern BI platforms increasingly integrate with AI tools to enhance these capabilities through machine learning algorithms and automated pattern recognition.
By using these insights, businesses can make data-driven decisions based on market trends, forecasts, and key performance indicators (KPIs).
Key Advantages of Business Intelligence (BI) Tools
Business intelligence (BI) tools empower organizations to make data-driven decisions, improve efficiency, and drive growth. Here are some of the key benefits:
- Centralized Data Management: BI tools collect data from multiple sources, such as databases, CRM and ERP systems, and online portals. This allows businesses to organize and analyze data in one place, making it easier to identify trends, track issues, and generate reports;
- Improved Data Access: Employees across different departments can access and analyze data without needing technical expertise. They can review sales performance, track operational metrics, and analyze customer data without relying on IT teams;
- Predictive Analysis: BI tools use historical and real-time data to help businesses identify patterns and make predictions. Companies can use these insights to anticipate market changes, detect irregularities, and adjust strategies as needed;
- Automated Reporting: Instead of manually compiling data in spreadsheets, BI tools generate reports and visualizations automatically. Users can access real-time insights, create interactive charts, and export data for presentations or further analysis;
- Cost and Efficiency Benefits: BI tools improve efficiency by automating data analysis, forecasting sales, and tracking business performance. This reduces manual work, improves accuracy, and helps businesses lower costs while making better financial decisions. Studies show that more than half of BI users see cost savings and increased revenue.
Key Factors in Choosing the Best Business Intelligence Tool
Here are the main criteria used to assess each BI tool:
Ease of Use
A BI tool should be accessible to all users, not just those with technical expertise. The best options process natural language queries and offer setup assistance, allowing teams to configure metrics and analyze data without requiring SQL knowledge. While advanced tools like Google BigQuery or Looker are designed for data analysts, this list focuses on BI solutions that are user-friendly for a broader audience.
Automation Features
Top BI tools integrate automation to simplify data analysis. Whether through AI-generated insights, automated report creation, or visual dashboards that update in real time, automation enhances efficiency and reduces manual effort.
AI Capabilities
BI software with built-in AI tools improves data analysis by offering interactive, conversational AI assistance and predictive analytics. Platforms that provide AI-powered forecasting scored higher, as they help businesses make data-driven decisions based on historical patterns.
Data Management
A strong BI platform must handle large data volumes efficiently, support data modeling, and offer diverse visualization options. Some tools excel in specific aspects of data management, such as warehousing, connectivity, or advanced reporting.
Integration Support
The best BI tools connect with multiple data sources, including CRM, ERP, and third-party applications. A platform with broad integration support allows businesses to manage and analyze data efficiently.
Based on these criteria, research, and hands-on testing, here are the top 17 business intelligence software solutions.
BI Software: Top Picks for Analytics and Reporting
Qlik
Pros:
- Wide range of data reporting and visualization features;
- AI-powered advisor provides insights and data connections;
- Fully functional mobile app.
Cons:
- High cost;
- Steep learning curve.
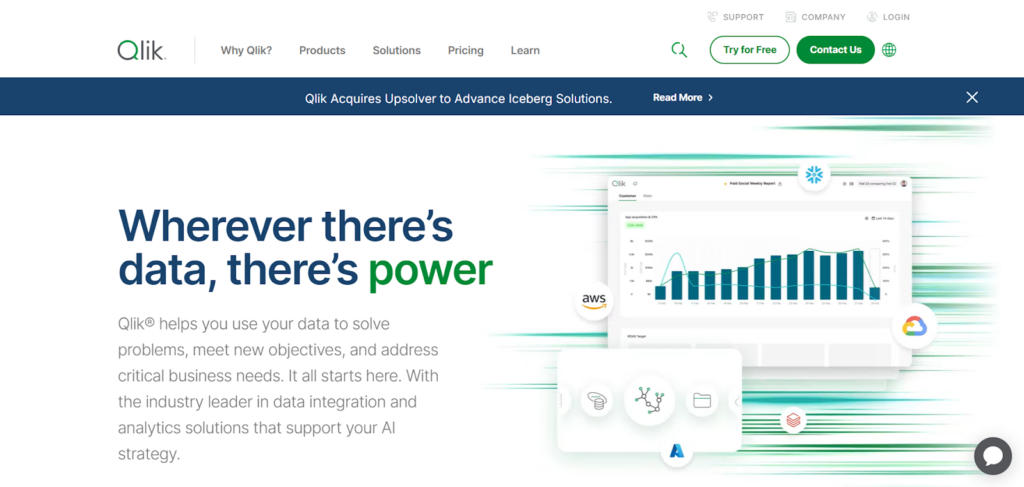
Qlik is a BI tool known for its advanced data visualization and reporting capabilities. It comes with built-in sample data, allowing users to explore its features without needing to import datasets first. Whether handling a single dataset or multiple sources, Qlik delivers clear and customizable graphs for sales figures and other key metrics.
The AI-driven Insight Advisor enables users to ask questions in natural language and receive insights, summaries, and predictive analytics. Additionally, Qlik’s mobile app provides access to reports and dashboards, allowing users to interact with data on the go.
However, its pricing is a significant factor to consider. The Standard cloud-based plan costs $825 per month for up to 20 users, which may be too expensive for smaller teams. The interface can also be complex, requiring a learning curve for those unfamiliar with BI software. Once learned, however, it offers a highly capable business analytics platform.
Zoho Analytics
Pros:
- Free on-premise plan available;
- Built-in AI tools and third-party integrations;
- User-friendly interface.
Cons:
- Outdated design.
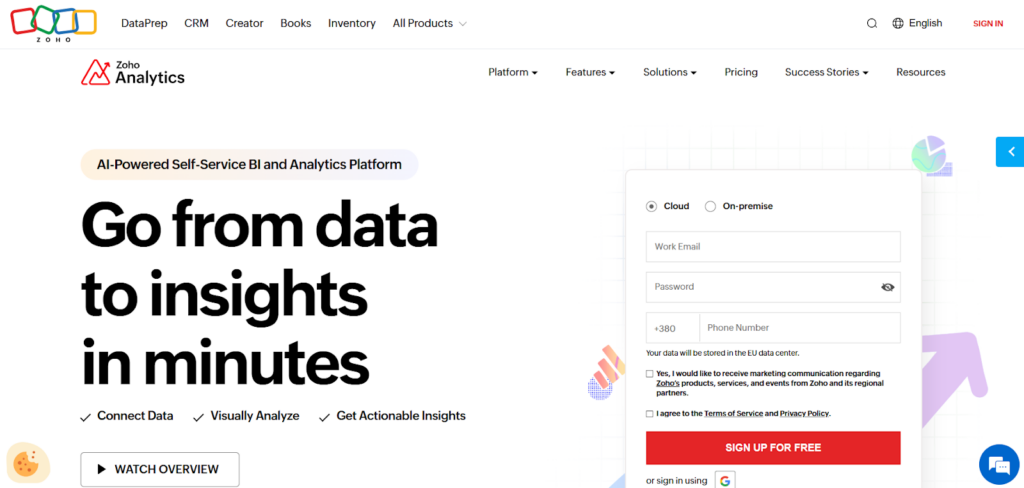
Zoho Analytics is a practical choice for individuals or small businesses looking for a cost-effective BI solution. Its free Personal plan allows users to install the software on a local server while providing access to key features like AI-powered analytics, unlimited reports, and predictive insights.
Designed for ease of use, Zoho Analytics includes walkthroughs and demo videos to help users get started. The AI assistant, Zia, enhances functionality by generating formulas, manipulating data, and performing predictive analytics through natural language queries.
SAP
Pros:
- Offers a full range of business intelligence tools, including on-premise, cloud, and hybrid solutions;
- Intuitive design makes it easier to use compared to other enterprise BI tools;
- Advanced Sharing Functions: Supports various sharing options, including reports, dashboards, and Microsoft Office compatibility;
- Provides tools like BusinessObjects and Lumira, reducing reliance on IT teams for basic BI tasks.
Cons:
- Users report unreliable support and platform administration issues;
- Acquired products may not integrate smoothly, causing inconsistencies;
- Some users experience slow or missing reports after queries;
- High query volumes can lead to server shutdowns, affecting performance.
SAP is a business intelligence tool designed for in-depth reporting, analysis, and interactive data visualization. It supports key areas such as customer experience (CX), CRM, digital supply chain, and ERP. One of its standout features is the self-service, role-based dashboards that allow users to create customized dashboards and applications. SAP provides a comprehensive solution for IT teams, end users, and management, consolidating multiple functionalities into a single platform. However, its complexity contributes to higher costs, making it a significant investment.
Microsoft Power BI
Pros:
- Integrates with other Microsoft products;
- Tracks historical changes to data.
Cons:
- Relatively slow loading times.
Microsoft Power BI is a business intelligence tool designed to integrate efficiently with Microsoft’s suite of applications, including Excel, PowerPoint, and Teams. Users can easily import data from Excel spreadsheets or export visualizations into PowerPoint for presentations. It also supports automation through Power Automate, enabling workflow connections across various applications.
One of its key features is automatic dataset recognition, which links related data without requiring manual setup. The built-in Query Editor allows users to track historical changes, making it easier to revert to previous states if necessary. Power BI is available in both desktop and web-based versions, catering to different user preferences.
SAS Viya
Pros:
- Provides automation tools for generating insights and dashboards;
- Highly flexible and customizable reporting options.
Cons:
- Outdated interface and slow loading times;
- High learning curve due to extensive feature set.
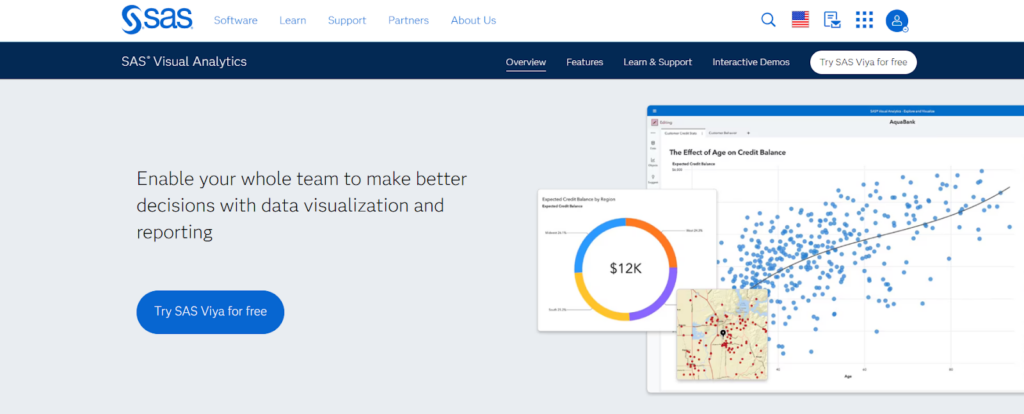
SAS Viya is a comprehensive BI tool designed for advanced data visualization and analytics. The platform features automation capabilities that suggest the best visualization methods based on the data being analyzed. Additionally, it generates natural language insights that can be added directly to reports and dashboards.
The software offers significant flexibility, allowing users to create dashboards using a drag-and-drop interface. Users can start from either the data level or the visualization level, making report creation adaptable to different workflows. Customization options include modifying axis labels, adjusting colors, and setting transparency levels.
SAS Viya also provides a mobile app for iOS, Android, and Windows, enabling users to interact with reports remotely.
Domo
Pros:
- Extensive library of over 1,000 data connectors and integrations;
- Tools for data calculations and workflow automation;
- Fast loading speeds.
Cons:
- Interface appears slightly cluttered and outdated.
Domo is a business intelligence platform designed to simplify data integration and analysis. It supports a vast range of pre-built data connectors, making it easy to integrate various data sources. Additionally, the Domo App Store provides access to APIs that can further extend its functionality.
Data preparation is simplified with the Magic ETL tool, which allows users to manipulate data using a drag-and-drop interface without requiring SQL knowledge. The Beast Mode feature enhances data processing by enabling calculations and transformations.
Performance is another strength of Domo, with rapid load speeds when opening datasets, generating dashboards, or filtering data.
Tableau
Pros:
- Strong collaboration features with extensive sharing options;
- Dynamic visualization builder using workbooks.
Cons:
- Lacks automated insights and visualization generation compared to other BI tools.
Tableau is a leading data visualization tool that prioritizes flexibility and collaboration. Users can create and share workbooks and dashboards, allowing teams to collaborate on data analysis. The platform provides different access levels—Creator, Explorer, and Viewer—to manage permissions effectively.
One of its standout features is the Accelerators, which are pre-built workbooks designed for integration with tools like Salesforce, Marketo, and ServiceNow ITSM. However, Tableau does not focus heavily on automation or AI-driven insights. Instead, it provides users with raw tools to build customized visualizations.
The platform does include a Recommendations tab that uses AI to highlight insights and relevant tables, but these features are less prominent than in competing BI solutions.
Sisense
Pros:
- Improved documentation and training resources;
- Intuitive wizard and customizable dashboards;
- Fast solution development.
Cons:
- Managing large datasets can be challenging;
- Error messages in Elasticube can be unclear;
- Requires frequent assistance from Sisense Support.
Sisense is a business intelligence and data analytics tool designed for ease of use, allowing users across an organization to handle large datasets, analyze data, and create visualizations without relying on IT support. It integrates with multiple data sources, including Google Ads, Google Analytics, and Salesforce. Utilizing in-chip technology, Sisense processes data faster than many other BI platforms. Recognized by industry leaders such as Gartner, G2, and Dresner, it is regarded as a top cloud analytics solution.
Metabase
Pros:
- Simple and user-friendly interface;
- Automatically generated dashboards for data visualization.
Cons:
- Limited functionality and customization options.
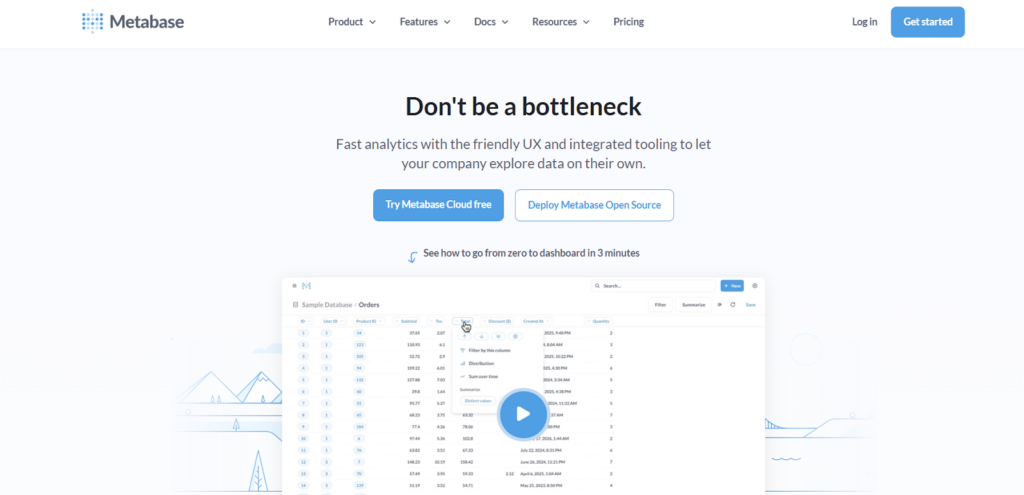
Metabase is a business intelligence tool designed for ease of use, featuring a modern interface and an intuitive setup process. It provides auto-generated dashboards called X-rays, which summarize key data insights visually. Users can explore datasets further using the right-side menu for deeper analysis.
While it requires no SQL knowledge, Metabase lacks some advanced BI functionalities compared to other tools. Additionally, signing up for the Cloud Starter plan requires a credit card, which is uncommon among similar platforms. Despite these limitations, its accessibility and clean design make it a strong option for basic BI needs.
IBM Cognos Analytics
Pros:
- AI assistant for automated data visualization and analysis;
- Collaboration features through Microsoft Teams integration.
Cons:
- Steep learning curve.
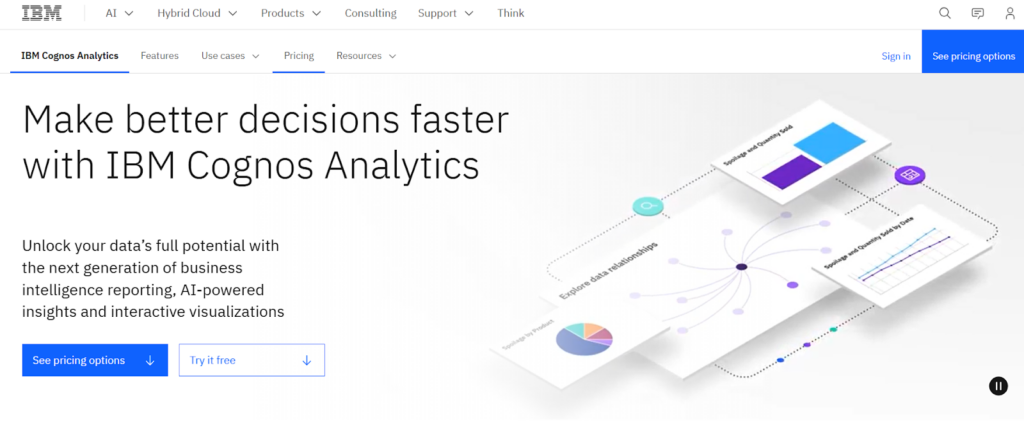
IBM Cognos Analytics is a BI platform known for its AI-driven insights and automation. The Cognos Analytics Assistant allows users to request charts, dashboards, and predictive analyses using natural language, making data exploration more efficient.
The platform also supports advanced forecasting, evaluating multiple algorithms and seasonal trends to provide more accurate predictions. Other key features include unique data visualizations (such as spiral charts), report annotation, automated report distribution, and direct integration with Microsoft Teams for collaboration.
Due to its complexity, Cognos has a significant learning curve, but it offers extensive tutorials and resources to help users get started.
Yellowfin BI
Pros:
- Quick setup (under 4 hours);
- Cost-effective for multiple users;
- Easy database connectivity and report creation;
- User-friendly with minimal training required;
- Strong integration with Big Data.
Cons:
- Limited cloud services;
- Requires coding for advanced customization.
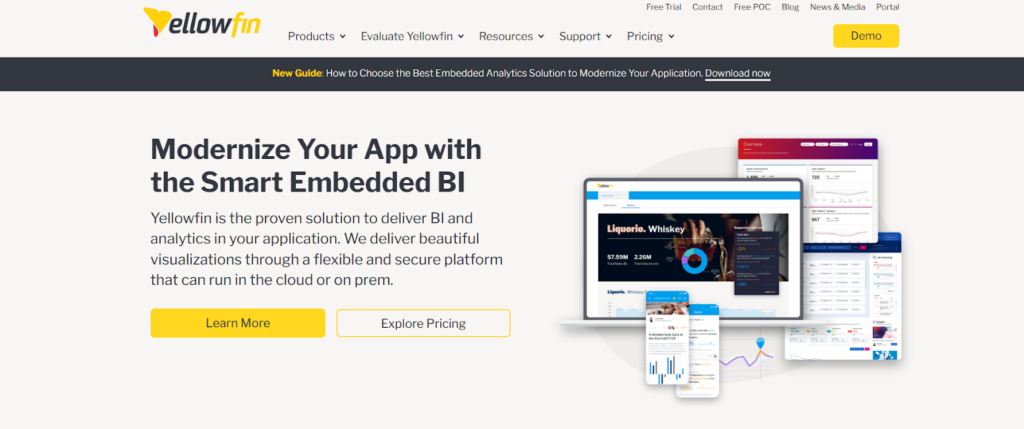
Yellowfin BI is a business intelligence and analytics platform that integrates visualization, machine learning, and collaboration. It offers intuitive filtering options like checkboxes and radio buttons to simplify data analysis. Dashboards can be accessed across multiple platforms, including mobile devices and web pages, providing flexibility in data accessibility. The platform also supports no-code and low-code development, making it easy to enhance dashboards and visualizations without advanced technical skills.
MicroStrategy
Pros:
- Maintains data structure and hierarchy for consistency;
- Customizable, user-friendly interface with strong visualization tools;
- Reliable performance with minimal crashes or glitches;
- Responsive design with good mobile accessibility.
Cons:
- Handling SQL queries and Microsoft Access can be error-prone;
- Managing historical data changes can be complex.
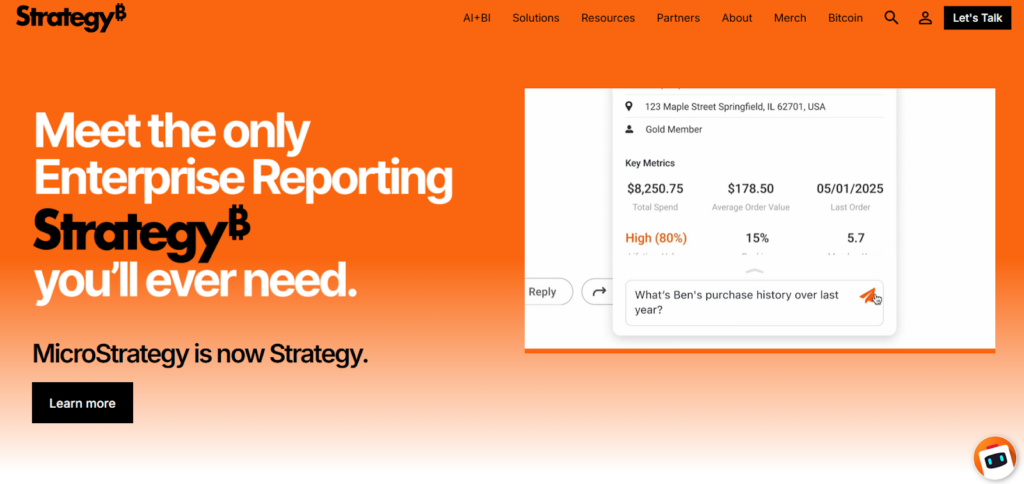
MicroStrategy is an enterprise business intelligence tool that provides high-speed dashboarding, data analytics, and cloud solutions. It supports trend identification, opportunity recognition, and productivity improvement by connecting to multiple data sources, including spreadsheets, cloud platforms, and enterprise data systems. The platform is accessible via desktop and mobile. However, the setup process can be complex, often requiring multiple parties and in-depth knowledge of the application.
Clear Analytics
Pros:
- Strong data security, governance, and compliance;
- Flexible ad-hoc reporting;
- Customizable auto-refresh for data updates;
- Reliable customer support.
Cons:
- Lacks OLAP (Online Analytical Processing);
- Needs advanced analytics (predictive and descriptive analysis);
- Limited visualization options;
- Team edition pricing could be improved.
Clear Analytics is designed for Excel users, offering an intuitive, Excel-based interface that requires minimal expertise. It provides self-service BI capabilities, allowing users to create, automate, analyze, and visualize data. The software integrates with Microsoft Power BI, utilizing Power Query and Power Pivot for data cleaning and modeling.
SAS Augmented Analytics & Business Intelligence

Pros:
- Simple syntax, easy to learn without programming experience;
- Efficiently manages and processes extensive datasets;
- Clear error logs simplify troubleshooting;
- Fully tested before release, ensuring stability and accuracy;
- Dedicated assistance with no external modifications due to its closed-source nature.
Cons:
- Lacks open-source flexibility and requires integration with tools like R for advanced analytics;
- Producing complex visualizations requires extra effort compared to R;
- New machine learning algorithms take longer to implement than in R;
- Requires more coding and lacks the free libraries available in R;
- Unlike R, text mining in SAS requires additional paid tools.
SAS is best known for its advanced predictive analytics, but it also offers a robust business intelligence platform. Established in the 1970s, it provides self-service BI tools that help users analyze data and make informed decisions. With a wide range of APIs, it allows for extensive customization. The platform supports high-level data integration, advanced analytics, and reporting, along with a text analytics feature for deeper contextual insights.
Oracle BI
Pros:
- Handles large enterprise data warehouse models;
- Strong for analysis over-reporting;
- Connects to multiple sources and integrates data efficiently;
- Supports BI Publisher Reporting and Direct Database Requests;
- Works with relational and non-relational data.
Cons:
- Cloud-based alternatives offer better visual options;
- Requires skilled database users due to multiple system layers;
- Needs significant hardware and storage for on-premise applications;
- Large-scale reports and too many users can cause crashes.
Oracle BI is an enterprise business intelligence solution offering a wide range of BI capabilities, including dashboards, ad hoc reporting, and proactive intelligence. It is designed for organizations handling large data volumes from both Oracle and non-Oracle sources. The platform provides data archiving, versioning, a self-service portal, and alerts/notifications, making it a robust choice for data analysis and management.
Google Data Studio

Pros:
- No infrastructure or installation required;
- Works well with Google Analytics, BigQuery, and Google Sheets;
- Intuitive interface with a minimal learning curve;
- Granular permissions for sharing and access management.
Cons:
- Requires third-party tools for real-time updates;
- Requires conversion to CSV or Google Sheets;
- Lacks advanced functions found in Power BI and Tableau;
- Dashboard speed decreases with complexity;
- Cloud-only, limiting use for organizations with strict security needs.
Google Data Studio is a free, web-based BI tool that allows users to create interactive dashboards and reports. It integrates with Google services and other data sources, enabling real-time data visualization. With a drag-and-drop interface and easy sharing options, it supports collaboration and simplifies data analysis for businesses of all sizes.
TIBCO Spotfire
Pros:
- Manages large teams across networks, reducing ownership costs;
- Connects with various tools, including R for advanced analytics;
- Available on-premises and cloud-based;
- Supports reporting, cross-analysis, and data evaluation;
- Offers multiple display options like heat maps, pie charts, and line graphs.
Cons:
- Steep learning curve with many features that are difficult to customize;
- Lacks sufficient learning resources and user guides;
- Expensive plans, with costs starting at $2,800 and going up to $51,150 per year;
- Difficult for smaller teams to implement and upgrade.
TIBCO Spotfire is a business intelligence and data visualization tool designed for advanced analytics. It offers interactive dashboards, predictive analytics, and real-time data processing, allowing users to analyze complex datasets efficiently. With drag-and-drop functionality and extensive data connectivity, it enables quick insights without heavy IT involvement, making it suitable for diverse industries.
Conclusion
Selecting a business intelligence (BI) tool depends on business size, data needs, and integration requirements. Google Data Studio and Microsoft Power BI work well within their respective platforms, while Tableau and TIBCO Spotfire offer strong visualization features. Qlik, SAP Business Objects, Oracle BI, and SAS handle large datasets and advanced analytics. Smaller businesses may prefer Zoho Analytics, Metabase, or Yellowfin BI for their simplicity and cost-effectiveness. Domo and Sisense provide automation and integration for dynamic workflows. The right BI tool should align with the organization’s data complexity, automation needs, and reporting goals.
