Your Kubernetes cluster looks calm on the surface, but something usually breaks beneath that calm exterior. A pod crashes without warning, or maybe latency spikes across your services without any obvious trigger. You stare at your terminal with no clear idea where to start looking for answers. This painful reality hits every team that skips proper Kubernetes monitoring during their initial setup phase.
Let’s look at what Kubernetes metrics you need to measure, as well as best practices and tools for monitoring Kubernetes.
Key Insights:
- Kubernetes monitoring tracks four layers: control plane components, worker nodes, pods, and the containers running inside them;
- The Kubernetes metrics server gives you real time CPU and memory data for autoscaling;
- kube-state-metrics provides metadata about deployments, ReplicaSets, and other resource objects;
- Prometheus remains the standard for collecting time series metrics from cloud-native applications;
- OpenTelemetry unifies metrics, logs, and traces into a single framework;
- eBPF technology is revolutionizing data collection without application instrumentation .
What is Kubernetes Monitoring
Kubernetes Monitoring tracks the health and performance of clusters in real time.
We think it goes way beyond basic checks because containers spin up and down so fast that simple logs just won’t cut it anymore. The setup usually pulls metrics from node pods and services then feeds them into dashboards that show everything from CPU spikes to network bottlenecks in one place. Honestly without solid monitoring a small issue can snowball into downtime that hits users hard.
Maybe the trickiest part comes from the distributed nature of it all.
Teams often layer tools like Prometheus for scraping data combined with Grafana for visuals and sometimes add alerting systems that ping the right people before things get ugly. This mix helps catch problems early yet the real value shows up when custom queries reveal patterns nobody expected.
In short, it keeps everything running smoothly in chaotic environments.
Kubernetes Metrics to Measure
You cannot monitor everything. The signal to noise ratio is brutal. Focus on these categories. Each one tells a specific story about your cluster health.
Control Plane Health
The control plane is the brain of your Kubernetes (K8s) cluster. If it fails, nothing works.
- kube-apiserver: Monitor request latency, error rates, and request volume. This component handles all API calls. Slow responses mean everything slows down;
- etcd: Track leader election changes, disk sync latency, and database size. etcd is the source of truth. Disk I/O problems here will corrupt your cluster state;
- kube-scheduler: Watch scheduling latency and error rates. If the kube-scheduler cannot place new pods, deployments hang forever;
- kube-controller-manager: Monitor controller work queue depth and processing times. A stuck controller means your desired state never becomes reality;
- cloud-controller-manager: Track interactions with your cloud provider API. Failures here break load balancers and persistent volumes.
Node Level Metrics
Worker nodes run your workloads. Each node runs kubelet, kube-proxy, and a container runtime like containerd or CRI-O.
- Resource utilization (CPU, memory, storage): Track usage per node. Watch for MemoryPressure or DiskPressure conditions. These trigger pod evictions;
- Node readiness: Monitor status transitions between Ready, NotReady, and Unknown. Frequent flapping indicates network or resource problems;
- kubelet health: Track API request latency and error rates. kubelet is your gateway to each node’s containers;
- kube-proxy performance: Watch iptables or IPVS sync times. Slow updates break service discovery.
Pod and Container Metrics
Pods are the smallest deployable units. Each pod contains one or more containers.
- CPU and memory usage per pod: Compare against requests and limits. A pod exceeding its request gets throttled. Exceeding limits gets killed;
- Container restarts: Track restart counts and reasons. CrashLoopBackOff means your app is failing to start repeatedly;
- Pod phase: Monitor Pending, Running, Succeeded, Failed, and Unknown states. Pods stuck in Pending usually lack resources;
- OOMKilled events: Out of memory kills are silent failures without monitoring. Track which containers get terminated.
Workload Health
Higher level abstractions manage your pods.
- Deployments: Track desired vs available replicas. A mismatch means rolling updates are stuck or failing;
- ReplicaSet: Monitor pod creation and deletion rates. A ReplicaSet that cannot create pods indicates deeper issues;
- DaemonSet: Check that every node has the required DaemonSet pod running. Missing pods mean node level problems.
Kubernetes Metrics Server vs Kube-State-Metrics
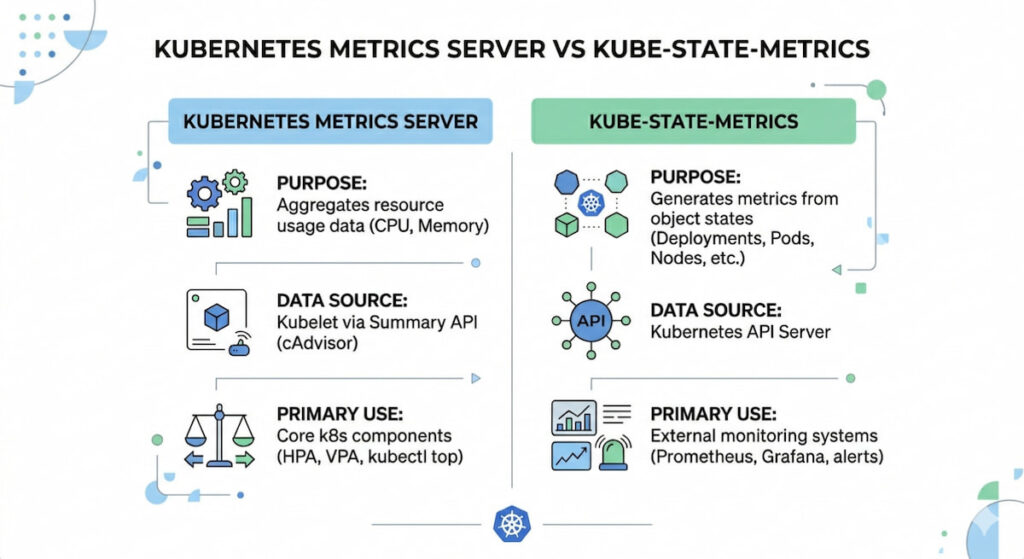
These two tools cause endless confusion. They serve completely different purposes .
| Tool | Data Type | Primary Use |
|---|---|---|
| Kubernetes metrics server | Real time CPU and memory per node/pod | Horizontal Pod Autoscaling (HPA), kubectl top |
| kube-state-metrics | Resource metadata (deployment status, pod phase, labels) | Dashboards, long term trends, cost allocation |
The Kubernetes metrics server collects data every 15 seconds and stores it in memory. It does not persist data. It exists to feed the Horizontal Pod Autoscaler (HPA) and Vertical Pod Autoscaler (VPA). kube-state-metrics listens to the API server and generates metrics about resource state. You need both for complete visibility.
Kubernetes Monitoring 5 The Best Practices
Throwing tools at the problem is not a strategy. These practices separate working monitoring from expensive noise.
1. Start with the Four Golden Signals
Google’s Site Reliability Engineering (SRE) book introduced this concept. Apply it to each cluster layer.
- Latency: Time to serve requests at the pod, service, and API level;
- Traffic: How much demand your system handles (requests per second);
- Errors: Rate of failed requests (HTTP 500s, gRPC errors);
- Saturation: How full your resources are (CPU, memory, disk, network).
Build dashboards around these four pillars. Everything else is secondary.
2. Implement Structured Logging
Unstructured text logs are useless at scale. Switch to JSON format. Add consistent fields: timestamp, severity, pod name, namespace, trace ID. Kubernetes 1.30 made structured logging stable for control plane components . Your applications should follow the same pattern.
Configure kubelet with JSON logging:
text

kubelet --logging-format=json -v=2
3. Use RBAC and Namespaces for Isolation
RBAC (Role-Based Access Control) limits who can see what. Namespaces isolate teams and environments. Apply both to your monitoring stack. A developer does not need to see production metrics. A finance team does not need access to raw container logs.
Create separate namespaces for monitoring tools. Example: monitoring, logging, tracing. Apply network policies to control traffic between them.
4. Set Up Multi Layer Alerting
Most teams configure alerts at the pod level. That catches individual failures. But you also need alerts at the cluster, node, and control plane levels.
- Cluster level: API server latency > 1 second, etcd leader changes > 3 per hour;
- Node level: MemoryPressure or DiskPressure conditions, node NotReady for > 5 minute;
- Pod level: CrashLoopBackOff for > 2 minutes, OOMKilled events;
- Control plane: Scheduler failures, controller manager queue depth > 100.
Use different severity levels. PagerDuty for production outages. Slack for warning conditions. Email for informational events.
5. Adopt OpenTelemetry for Vendor Neutrality
OpenTelemetry lets you instrument your code once and send data anywhere. According to the CNCF Annual Survey (2025), 49% of organizations now use OpenTelemetry in production, a significant increase from 39% in 2024 as it solidifies its position as the industry standard for observability. The OpenTelemetry Collector runs as a DaemonSet on each node. It receives telemetry from your applications and forwards it to backends like Prometheus, Jaeger, or Datadog.
Deploy the collector with this minimal configuration:
yaml

apiVersion: opentelemetry.io/v1alpha1

kind: OpenTelemetryCollector

metadata:

  name: otel-collector

spec:

  mode: daemonset

  config: |

    receivers:

      otlp:

        protocols:

          grpc:

            endpoint: 0.0.0.0:4317

    processors:

      batch:

        timeout: 5s

    exporters:

      prometheus:

        endpoint: 0.0.0.0:8889
This sounds recursive. It is necessary. Your monitoring stack consumes resources. Prometheus can crash under high cardinality. Loki can run out of disk space. Set up health checks for your monitoring tools themselves.
Watch Prometheus memory usage. It stores all active time series in RAM. Too many unique label combinations will OOM kill your metrics server.
Kubernetes Monitoring Tools and Solutions
Getting kubernetes monitoring right from day one can save your team from waking up to a crashed production cluster at 3 AM. But the landscape of observability tools has exploded, making the initial choice genuinely overwhelming for both newcomers and seasoned DevOps engineers.
We need to track pods, nodes, metrics, logs, and traces across dynamic environments where containers come and go like taxis in a busy city. Without proper monitoring, you’re essentially flying blind through a storm.
Prometheus and Grafana
The open-source powerhouse pairing handles Kubernetes monitoring with remarkable flexibility. Prometheus scrapes metrics from your cluster components, nodes, and applications using a pull-based model that works beautifully with ephemeral workloads.
What makes this combination so effective? Service discovery automatically finds new pods. The PromQL query language lets you ask complex questions about your data, like “show me memory usage for all pods in the namespace ‘production’ over the last six hours.”
Grafana provides the visual layer with hundreds of pre-built dashboards specific to Kubernetes. You can set up alerting rules directly in Prometheus, then route notifications to Slack, PagerDuty, or email.
Key capabilities:
- Node and pod level CPU, memory, network, and storage metrics;
- Horizontal Pod Autoscaler metrics for scaling decisions;
- Custom application metrics via client libraries;
- Long term storage using Thanos or Cortex;
- Alertmanager for deduplication and grouping of alerts.
Many teams start here because the cost is zero and the community support is massive. The learning curve for PromQL can feel steep, but that investment pays off when you’re debugging weird latency spikes.
Datadog

Datadog offers a commercial solution with deep Kubernetes monitoring features baked directly into its agent architecture. The agent runs as a DaemonSet on each node, collecting everything from container logs to network performance data without requiring separate exporters.
Their live container view shows you running processes inside each pod, which is shockingly useful when you suspect a memory leak in a specific container. You can trace requests across service meshes like Istio or Linkerd, seeing exactly where latency gets introduced.
The machine learning features automatically detect anomalous behavior, like a pod suddenly consuming 40% more CPU than its normal baseline. Datadog integrates with AWS, Azure, and GCP at the control plane level, so you see both your managed Kubernetes service metrics and your application metrics in one pane of glass.
Pricing scales with node count and custom metrics volume, so costs can escalate quickly for large clusters. Smaller teams sometimes find themselves surprised by monthly bills after adding extra integrations.
New Relic Kubernetes Monitoring
New Relic takes a different approach with a unified agent that combines metrics, events, logs, and traces into what they call “telemetry data.” Their Kubernetes integration deploys in minutes using a Helm chart that automatically discovers services and pods.
The workload analysis groups containers by deployment or stateful set, making it easy to spot that one misbehaving replica dragging down overall performance. You can query all your data using NRQL, their SQL-like language that supports aggregations and time series functions.
Pixie, an open source project they acquired, provides automatic protocol decoding for HTTP, MySQL, Redis, and DNS traffic between services. No code changes needed.
Free tier includes 100 GB per month of data ingestion, which works for small clusters or testing environments. Enterprise customers get access to anomaly detection and predictive alerts.
Amazon CloudWatch Container Insights
For teams already invested in AWS, CloudWatch Container Insights provides Kubernetes monitoring without managing extra infrastructure. The CloudWatch agent running in your EKS or self-managed clusters sends performance data every minute, including aggregated metrics at the cluster, node, pod, and service levels.
You get log groups automatically organized by container name, plus CloudWatch Logs Insights for searching across thousands of log streams simultaneously. The CloudWatch console includes a Kubernetes dashboard showing pod restarts, node health, and resource utilization in a clean layout.
One limitation worth knowing: Container Insights samples data every minute, which might miss short lived spikes that last only 10 or 20 seconds. For high resolution metrics, you would need a separate solution like Prometheus running alongside it.
Costs include per node monitoring fees plus standard CloudWatch log ingestion rates. Heavy log producers can see significant monthly charges if you aren’t careful with filtering.
Sysdig Monitor
Sysdig built its reputation on container security and deep visibility, but their Kubernetes monitoring capabilities deserve attention too.The agent uses eBPF technology to capture system calls and network events without adding overhead to your application containers.
You can see the exact command line arguments used when a process spawned inside a container. This forensic level detail helps when investigating breaches or simply debugging why a container keeps crashing.
Sysdig integrates with Falco, their open source runtime security tool, so you can trigger monitoring alerts based on security rules like “alert if anyone runs a shell inside a production container.” The drag and drop dashboard builder works for people who hate writing YAML for Grafana.
Pricing is competitive with Datadog but includes security features as part of the platform rather than separate add ons.
Log Monitoring Integration
No monitoring solution works without good logs, and Kubernetes complicates log collection significantly. Containers write to stdout and stderr, but those logs disappear when pods die unless you ship them somewhere persistent.
Most tools above include log aggregation, but specialized options like Loki (from Grafana Labs) or Elasticsearch with Fluent Bit deserve mention. Loki integrates directly with Prometheus labels, so you can jump from a metric alert showing high error rates into the exact logs from those pods.
Fluent Bit runs as a DaemonSet with minimal CPU usage, typically under 50 millicores per node. It can send logs to multiple destinations simultaneously: for example, high severity logs go to Datadog while everything else goes to cheap S3 storage.
Making Your Final Choice
The right kubernetes monitoring stack depends entirely on your team size, budget, and tolerance for configuration work.
Small teams with one or two clusters should probably start with Prometheus and Grafana. The free cost and massive community mean you’ll find answers to almost any problem. Large enterprises running hundreds of clusters often prefer Datadog or Sysdig because support contracts matter when your on-call engineer is sleeping at 2 AM.
AWS shops with moderate monitoring needs can use Container Insights and save themselves the operational headache of running their own Prometheus servers. Companies needing security compliance should evaluate Sysdig first, since the eBPF data provides audit trails that satisfy most compliance frameworks.
Whatever you pick, ensure it supports metric retention policies that match your requirements. Debugging a production incident from three weeks ago is impossible if your monitoring only keeps seven days of history. Test alert routing thoroughly before you need it. Document your dashboard locations and query examples for the whole team.
Good monitoring doesn’t prevent failures, but it turns a three hour outage into a fifteen minute fix. That difference keeps customers happy and engineers employed.
