Database monitoring tracks every pulse of your data systems so applications stay responsive and reliable even under heavy pressure.
Teams watch resource usage and query behavior constantly because one overlooked spike can cascade into slow pages or failed transactions. We think modern setups need more than basic checks since data volumes explode and workloads mix online transactions with batch jobs. Effective database monitoring or database performance monitoring prevents surprises by catching issues before users notice anything wrong.
Maybe the real power comes from combining metrics with logs and traces in one view.
What Is Database Monitoring
Database monitoring means continuous observation of how well a database handles its tasks including speed of operations and health of the underlying server.
It covers performance tracking security signals and availability checks across relational systems like PostgreSQL or MySQL and NoSQL options too. This practice collects snapshots of activity then compares them against normal patterns to spot deviations quickly.
We think it goes far beyond simple uptime pings.
Engineers review query execution details alongside hardware consumption so they understand exactly where pressure builds. Honestly without steady oversight even well designed schemas degrade under real world traffic.
Database monitoring also includes review of logs that record slow operations or maintenance events.
In short, it keeps data systems predictable and fast.
Key Components of Database Monitoring
- Real-time collection of performance data from servers and queries;
- Analysis of logs including slow query logs and maintenance records;
- Visualization through dashboards for quick insights;
- Alerting systems that notify teams of anomalies.
Why Database Monitoring Important
Businesses lose revenue and trust when databases slow down or crash unexpectedly.
Database monitoring protects against that by delivering early warnings on rising load or failing components. We think it directly ties to user satisfaction since faster query response times mean smoother experiences in e-commerce or analytics apps. Organizations that invest here cut downtime dramatically and extend hardware lifespan through smarter capacity planning.
The High Cost of Database Downtime
Unplanned downtime hits hard. EMA Research data from 2024 shows unplanned downtime averages $14,056 per minute across organizations. Over 90% of midsize and large enterprises report that one hour of downtime costs more than $300,000. Large enterprises sometimes face $23,750 per minute or roughly $1.4 million per hour.
Maybe the numbers feel staggering yet they reflect lost productivity, customer churn and recovery efforts.
Dense financial impacts make strong database performance monitoring a business necessity rather than an option.
Choppy outages during peak hours amplify the damage.
How Database Monitoring Works
Database monitoring gathers data from multiple sources then processes it for insights and alerts.
Agents or built in exporters pull metrics like CPU load and query times at regular intervals. OpenTelemetry or OTel serves as a vendor agnostic standard that standardizes traces and metrics so teams switch backends without rewriting instrumentation.
We think this standardization simplifies setups across hybrid environments. Adoption of OpenTelemetry continues to grow with vendor sourced distributions rising sharply in recent surveys. The 2025 EMA report further notes that nearly half of IT professionals have already implemented OpenTelemetry, and organizations have reported up to 20% ROI from adoption.
The process usually involves collection analysis, visualization and alerting. Tools scrape database specific stats through plugins or direct queries then store them in time series databases for trending.
Logs from slow query files or maintenance tasks feed into the same pipeline for correlation.
Maybe the magic happens when anomalies trigger automated notifications or even self healing actions in advanced platforms.
Dense telemetry streams get filtered by rules or machine learning models that learn normal behavior over time.
Short version agents watch the database agents export data dashboards display trends and alerts notify humans or systems.
Steps in a Typical Database Monitoring Workflow
- Instrumentation of the database and application layers;
- Data collection using agents or OpenTelemetry;
- Storage and aggregation of metrics and logs;
- Analysis and correlation for root cause detection;
- Visualization and alerting for team response.
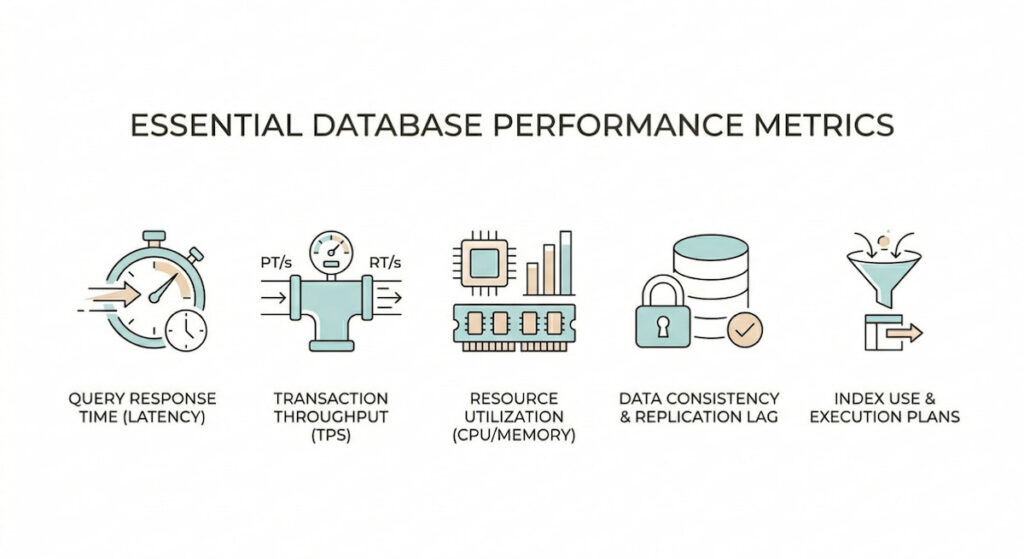
Essential Database Performance Metrics
Several key indicators tell the real story of database health.
- Query performance sits at the top of the list with focus on slow queries response time and overall query efficiency. Teams track how long each statement takes to complete and flag those exceeding thresholds;
- Resource utilization covers CPU memory disk storage and cache hit ratios because low cache performance forces more expensive disk reads. Throughput measured in queries executed per second minute or hour shows whether the system keeps pace with demand;
- Open connections need watching since too many exhaust limits cause timeouts while too few limit concurrency;
- Errors including query failures get counted and categorized so patterns emerge around specific tables or operations;
- Shard distribution and load matter in distributed setups where uneven splits create hot spots.
We think combining these metrics paints a complete picture. Maybe connection pool stats reveal application side misconfigurations early.
Dense batches of metrics require smart aggregation to avoid alert fatigue.Choppy spikes in any area demand immediate attention. Database logs supplement these numbers by recording exact slow statements or deadlocks. Availability monitoring tracks server uptime and replication lag in clustered environments.
Must Track Metrics List
- Query response time and execution duration for slow queries;
- Throughput in queries per second or transactions per minute;
- Resource utilization including CPU memory and disk I/O;
- Open connections and connection pool health;
- Error rates from query failures;
- Cache hit ratios to measure memory efficiency;
- Shard distribution and load balance in scaled systems.
Common Database Performance Bottlenecks
Slow queries top the list of headaches because missing indexes or bad joins scan entire tables unnecessarily.
Resource utilization problems arise when CPU memory or disk I/O hit saturation points especially during large batch jobs.
Contention from lock contention and concurrent access blocks transactions waiting for rows or tables.
Types waste space and slow comparisons while poor indexing forces full table scans.
Network latency between application and database servers adds invisible delays that compound under load.
Workload imbalances occur when online transactions mix with heavy analytics without proper separation.
We think shard distribution issues create uneven load that degrades overall throughput.
Maybe connection pool exhaustion looks like database slowness but actually stems from application configuration.
Dense I/O waits on mechanical disks or overloaded SSDs drag everything down.
Choppy error rates signal deeper schema or query problems.
Optimization through indexing proper data types and query tuning often resolves many of these without hardware changes.
Database logs help pinpoint exact statements causing pain.
Honest observation most bottlenecks trace back to design or configuration rather than raw hardware limits.
Frequent Bottlenecks and Causes
- Slow queries due to missing indexes or inefficient joins;
- Lock contention from concurrent access patterns;
- High resource utilization on CPU memory or disk;
- Uneven shard distribution in distributed databases;
- Workload mixing of transactional and analytical jobs.
AI-Powered Database Monitoring
AI brings predictive power to database monitoring by learning baselines and spotting anomalies faster than rule based systems. Platforms use machine learning to analyze query patterns and forecast when resource utilization might breach limits.
According to The Business Research Company’s Database Monitoring Software Market Report 2026, the database monitoring software market is expected to grow from $2.69 billion in 2026 to $4.7 billion by 2030 at a CAGR of 15%, driven by increasing adoption of AI-driven database performance monitoring. We think this reduces mean time to resolution significantly especially in complex microservices architectures.
Maybe AI surfaces recommendations for indexing or query rewrites based on real execution data.Dense telemetry volumes make manual review impractical so automation filters noise and highlights actionable items.
OpenTelemetry data feeds nicely into these AI systems because of its standardized format. Choppy unexpected drops in throughput get flagged with context about recent workload changes. Some solutions simulate future loads or recommend scaling actions before problems hit production.
Database performance monitoring gains depth when AI correlates metrics across infrastructure application and database layers. Short version AI turns raw data into smart guidance.
Database Monitoring: Best Practices
Start by establishing clear baselines for normal operation across all key metrics.
We think regular review of query performance through slow query logs prevents small inefficiencies from growing. Alignment monitoring with business goals so efforts focus on metrics that impact users most like response time during peak hours.
Choose tools that scale with your environment and support OpenTelemetry for future proofing. Maybe implement alerting thresholds thoughtfully to avoid noise while catching real issues early. Dense configurations benefit from automation that applies consistent rules across instances.
Monitor both production and development environments to catch problems before they reach live traffic.
Optimize through indexing tuning and proper data types as ongoing tasks rather than one time fixes.
Track shard distribution and load in scaled setups to maintain balance. We think periodic capacity planning based on historical trends avoids surprise shortages.
Database logs deserve regular inspection for anomalies or unexpected maintenance events. Honest practice involves testing monitoring setups under load so they perform when needed most.
Vary retention policies based on compliance and debugging needs.
Best Practices Checklist
- Define baselines for query response time throughput and resource utilization;
- Use OpenTelemetry for vendor agnostic data collection;
- Review slow query logs weekly and optimize top offenders;
- Set intelligent alerts based on business impact rather than raw thresholds;
- Combine metrics logs and traces for full context;
- Conduct regular optimization including indexing and query tuning;
- Monitor availability and replication health in clustered setups.
Database monitoring evolves with technology so stay curious about new standards and capabilities.
