You cannot fix what you cannot see, and that old IT saying still holds true after decades of practice. But the way we see our systems has changed completely from twenty years ago when you simply looked at a single CPU graph and that was enough to understand everything. Let’s break down observability vs monitoring without the marketing fluff so you can make real decisions for your own stack.
Now we run microservices across multicloud environments where a single user click touches fifty different services running on three different cloud providers.
Monitoring tells you something broke while observability tells you exactly why it broke, and this distinction matters more than maybe you think right now.
Key Takeaways:
- Monitoring tracks known failures using predefined dashboards and alerts. It answers “what is broken?”;
- Observability explores unknown failures using logs, metrics, and traces. It answers “why did it break?”;
- Distributed architectures require observability because failures become unpredictable;
- Root cause analysis is faster with distributed tracing and telemetry data;
- Both tools work together. You need monitoring for routine health checks and observability for deep exploration;
- Causal AI engines like Dynatrace Davis AI now automate this detection.
What Is Monitoring
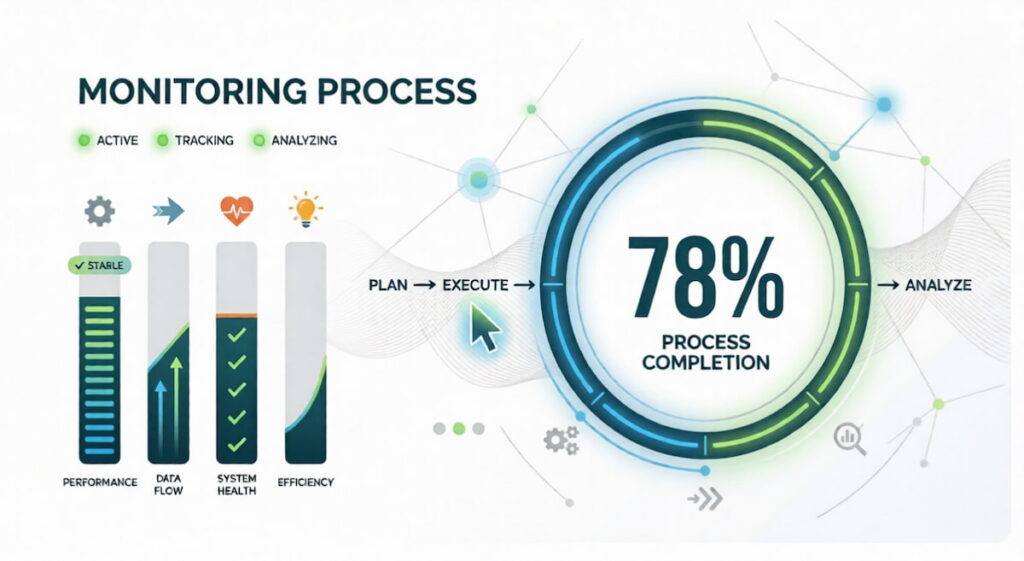
Monitoring is the practice of collecting predefined data points from your systems. You decide ahead of time what matters. CPU usage. Memory consumption. Disk space. Request rates. Then you build dashboards. You set thresholds. When a metric crosses a line, you get an alert.
Monitoring relies on metrics. These are numerical measurements collected at regular intervals. Think about temperature readings for your servers. Gauge metrics go up and down. Current CPU load. Active connections. Queue length. Delta metrics measure change over time. Requests per second. Bytes sent. Errors per minute. Cumulative metrics only increase. Total requests served. Total bytes transmitted and failures.
You store these in time series databases. Prometheus. Graphite. InfluxDB. Then you visualize them with tools like Grafana. Alerts fire when thresholds break. A typical rule: “If 95th percentile latency exceeds 500ms for five minutes, page the on-call engineer.”
What Monitoring Does Well
Monitoring excels at known failure modes. Your disk fills up. You have a rule for that. Your database connection pool runs dry. You have a rule for that. Application performance monitoring (APM) tools like New Relic or Datadog started as monitoring platforms. They track system health across thousands of servers. DevOps teams rely on monitoring for deployment validation. Did the CPU spike after the new release? Yes or no. Quick answer. Quick action.
Where Monitoring Falls Short
Monitoring fails when you face the unknown. A microservices architecture has hundreds of moving parts. Your dashboard shows everything is green. But users are complaining. Slow checkout. Random timeouts. You have no rule for this because you never saw this failure before. Your metrics say latency is fine. Your logs show no errors. You are stuck. This is where monitoring hits a wall. It only knows what you told it to watch.
What Is Observability
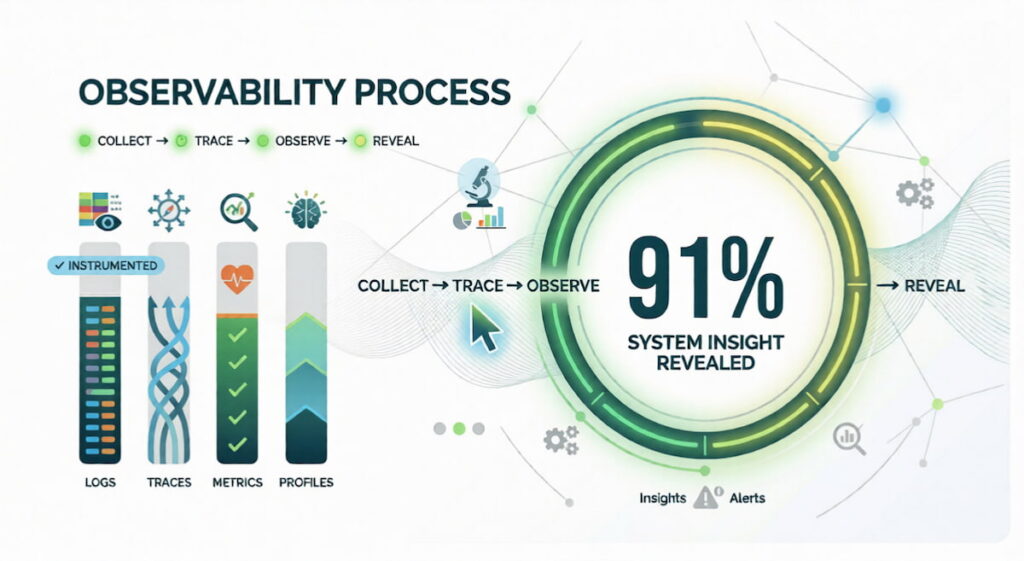
Observability comes from control theory. In engineering, a system is observable if you can understand its internal state by looking at its external outputs. For software, that means collecting enough telemetry to ask any question. Not just the questions you thought to ask yesterday. Any questions.
The 3 Pillars of Observability
You need three types of data. Logs, metrics, and traces. People call these the three pillars of observability.
- Logs are discrete events captured as text strings, such as “User 123 clicked login at 14:32:01” or “Database connection timed out,” and while this text format is often messy and unstructured, it remains absolutely invaluable for debugging complex failures;
- Metrics are aggregated measurements like request rate, error percentage, and average latency, all of which are simple numbers that make them easy to store and even easier to graph across time;
- Traces follow a single request as it jumps from service to service. A user clicks “buy.” That request goes through your API gateway, then your auth service, then your inventory service, then your payment processor, then your shipping service. A distributed trace shows every hop.
How Observability Changes Root Cause Analysis
Root cause analysis becomes an exploratory process when you have proper observability tools in place. You see high error rates appearing on your dashboards but you do not know why, so you start querying your telemetry data rather than guessing. You pull all distributed traces from the last hour, filter by slow responses, and eventually find one particular microservice that adds 800ms of latency to every request passing through it. You drill into that service’s logs and notice frequent garbage collection pauses, which leads you to identify a memory leak as the underlying cause. You fix the memory leak and the slowdown disappears, and observability let you discover this even though you had no predefined rule or alert for “garbage collection causing a checkout slowdown.”
Observability for Modern Architectures
Distributed architectures demand observability. A monolithic app has maybe three components. A microservices app has three hundred. Failures are weird. A slow database in one region. A misconfigured load balancer. A race condition that only appears when two specific services talk at the same time. You cannot predict these failures. You cannot write alerts for them ahead of time. You need the ability to explore. To ask new questions. To follow the data wherever it leads.
We think observability is the only way to survive multicloud environments. Your metrics come from AWS CloudWatch. Your logs come from Azure. Your traces come from a third party tool. Observability platforms pull all this together. They give you a single query language. A single interface. A single place to ask “what just broke?”
Key Differences: Monitoring vs. Observability
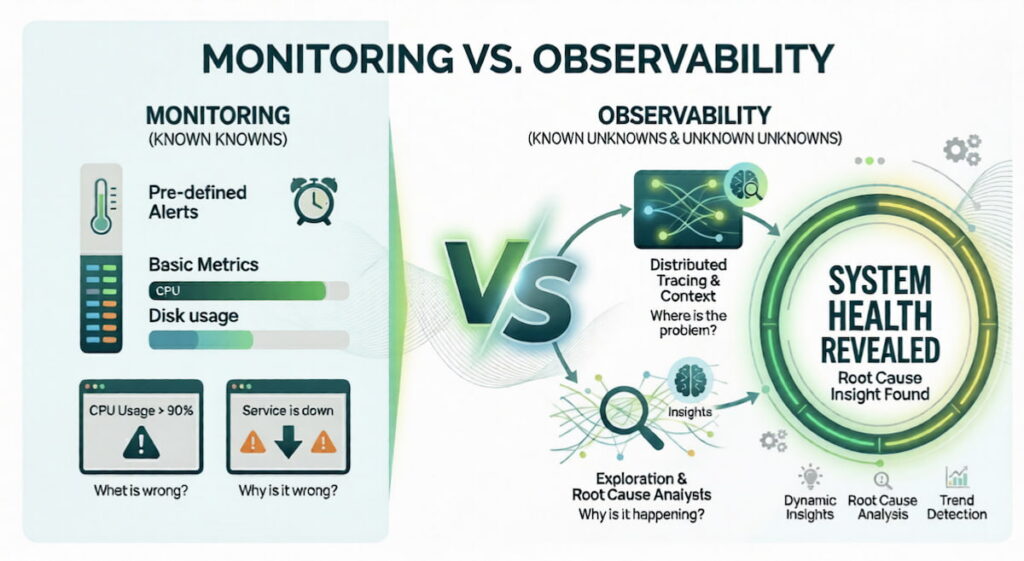
The difference is philosophical. Monitoring asks “what is happening?” Observability asks “why is it happening?” One is passive. One is active. One is reactive. One is exploratory.
| Aspect | Monitoring | Observability |
|---|---|---|
| Question answered | “What is broken?” | “Why did it break?” |
| Data type | Predefined metrics | Logs, metrics, traces |
| Failure detection | Known failures only | Known and unknown failures |
| Alerting | Threshold based | Anomaly based |
| Exploration | Limited | Unlimited queries |
| Architecture fit | Monoliths, simple SOA | Microservices, distributed systems |
| Maturity | Decades old | Emerging (past 5-8 years) |
Data Collection Differences
Monitoring collects data on a schedule. Every fifteen seconds. Every minute. You lose granularity. Observability collects everything. Every request. Every log line. Every trace span. Storage costs are higher. But so is visibility.
Metrics in monitoring are usually aggregated. Average CPU over one minute. That hides spikes. An 800ms latency spike that lasts two seconds gets averaged away. Observability keeps raw telemetry. You can zoom in. You see the spike. You see exactly what caused it.
Alerting vs. Exploration
Monitoring is alert driven. Something crosses a threshold. You get a page. You wake up at 3am. You fix the known problem. Observability is exploration driven. You notice a trend. Slightly higher error rates. Not enough to page. But weird. So you explore. You pull traces. You find a pattern. You fix it before it becomes a page at 3am.
User Experience and Security
User experience monitoring used to be simple. Average page load time. Bounce rate. Now you need observability. A user in Brazil has slow loads. Users in New York are fine. Why? Distributed tracing shows the CDN node in Sao Paulo is failing over to a secondary region. That adds 400ms. You fix the CDN configuration. Security also benefits. An attacker tries to pivot across services. Observability shows the unusual trace pattern. You catch it early.
Similarities Between Observability and Monitoring
They are not enemies. They are partners. Both collect telemetry. Both help you understand system health. Both are essential for DevOps and DevSecOps teams.
Shared Data Sources
Both use logs, metrics, and traces. The difference is how you use them. Monitoring looks for known patterns. High error rate. Low disk space. Observability lets you ask new questions. “Show me all traces where database latency exceeds 200ms but cache hit ratio is below 10%.” Same raw data. Different query style.
Shared Goals
Both aim to reduce downtime. Both speed up root cause analysis. Both improve application performance. According to the Splunk State of Observability 2023 report (conducted with Enterprise Strategy Group), observability leaders are 4x as likely to resolve unplanned downtime in minutes (versus hours or days), and 76% of organizations report downtime can cost up to $500,000 per hour . You need both.
Tool Overlap
Many tools started as monitoring platforms and added observability features. Dynatrace is a good example. Its Davis AI engine ingests metrics, logs, and traces. Then it applies causal AI to find root causes automatically. You get a software intelligence platform that does both. Datadog, New Relic, and Honeycomb follow similar paths.
Monitoring and Observability Trends
Space changes fast. Here is what is happening right now.
Causal AI Takes Over Root Cause Analysis
Causal AI is different from traditional machine learning. Old ML finds correlations. “When A happens, B often happens.” Causal AI finds causes. “A causes B.” Dynatrace built this into its Davis AI engine. The system ingests telemetry from your entire stack. It builds a model of dependencies. When something breaks, Davis traces the causal chain automatically. No manual exploration. No guesswork. Just an answer: “The checkout service is slow because the payment gateway API returned 504 errors for 12% of requests starting at 14:23 UTC.”
We think this is the future. Observability plus automation. You still explore. But the AI does the heavy lifting.
OpenTelemetry Becomes the Standard
OpenTelemetry is an open source project. It provides standard APIs for generating logs, metrics, and traces. No more vendor lock in. You instrument your code once. You send data to any backend. Honeycomb. Dynatrace. Jaeger. Prometheus. The Cloud Native Computing Foundation (CNCF) backs it. Adoption is exploding. In 2021, approximately 14% of organizations used or evaluated OpenTelemetry. By 2024, that number had grown to 39% in production (with an additional 23% evaluating it), according to the CNCF Annual Survey.
Security Observability Emerges
DevSecOps teams want security data inside their observability platforms. Not a separate dashboard. Same logs. Same traces. But with security context. A trace shows a request hitting your API. Security observability adds threat intelligence. That IP address is known to be malicious. That payload contains a SQL injection attempt. You see the attack in the same view as your performance data. Companies like Cribl and Observe are building this.
From Metrics to Contextual Insights
Raw metrics are cheap. Contextual insights are expensive but valuable. A CPU spike means nothing alone. A CPU spike during a garbage collection event, while a specific user segment is active, on a Tuesday after a deployment? That is actionable. Observability platforms now correlate across data types automatically. You do not ask for the correlation. The system shows it to you.
Proactive Detection and Remediation
Proactive detection is the holy grail. Spot problems before users feel them. Observability plus predictive analytics. Your trace data shows a slow upward trend in database query time. Not yet critical. But the AI predicts it will cross the threshold in 45 minutes. It spins up a red replica automatically.
Remediation happens without human action. This exists today in advanced platforms like Dynatrace and Splunk Observability Cloud. According to Splunk’s research, 31% of organizations report AIOps helps predict problems before they become customer-impacting incidents.
The Rise of eBPF
eBPF is a Linux kernel technology. It lets you run sandboxed programs inside the kernel without changing source code. For observability, this is huge. You can see every system call. Every network packet. Every function call. No instrumentation required. Tools like Cilium and Pixie use eBPF to provide deep telemetry with almost zero overhead. Expect this to replace many traditional agents in the next three years.
Cost Optimization Becomes Critical
Storing every trace and log is expensive. Companies are getting bills for $50,000 per month. So trends are shifting. Sampling. Aggregation. Tiered storage. Hot storage for recent data. Cold storage for old data. Delta metrics instead of raw logs where possible. The observability vs monitoring debate now includes a third dimension: cost. Smart teams use monitoring for high volume, low value data. They reserve observability for critical paths and incident investigation.
