Nobody likes a slow app, you pour weeks into building something slick with Node.js, and then production hits. Suddenly, response times go haywire. Memory usage climbs like a drunk monkey on a palm tree. Users start grumbling. That’s where node.js monitoring steps in to save your bacon.
We think monitoring gets ignored until something breaks. Don’t be that person and let’s walk through what this stuff actually means, why it matters, and which tools won’t let you down.
What is Node.js Performance Monitoring
Monitoring Node.js means actively collecting, analyzing, and acting on data from your running applications. You track CPU load, memory consumption, request latency, and event loop delays. The goal? Catch problems before your users do. But monitoring isn’t just staring at a dashboard and nodding wisely. It’s active surveillance. You set up alerts, watch trends over time, and connect performance data to business outcomes. Think of a car’s instrument panel. You wouldn’t drive cross-country with the check engine light covered by duct tape.
Node.js runs on a single threaded event loop. That’s both its superpower and its Achilles’ heel. Block that loop, and everything stalls. So monitoring must focus on asynchronous execution patterns. If your event loop gets clogged with heavy computations, queued I/O operations pile up. Suddenly, your snappy API feels like dial-up internet.
Real observability goes beyond basic metrics. It asks “why” not just “what”. Why did latency spike at 2 PM? Was it a database query? A third party API? A memory leak simmering for days? Observability ties together logs, metrics, and traces so you can answer those questions fast. No more guessing. No more blaming the network when your own code is the real culprit.
Why is Node.js Monitoring Important
Skip monitoring, and you’re flying blind. That works fine on a Tuesday morning. Come Black Friday traffic, you’ll be scrambling with your hair on fire. Node.js monitoring gives you early warnings. It tells you when your error rates cross a threshold, when throughput drops off a cliff, or when garbage collection cycles start taking too long.
Application performance monitoring (APM) tools help you see the forest and the trees. Without them, you might think your code is fine while the database is actually melting down. Or you might blame the network when your own dependencies are the real culprit.
Here’s a real-life example. FoodMe, a sample food delivery app built on Node.js, began mysteriously slowing down every evening at 6:00 PM, without any code changes or deployments. It turned out that order confirmation emails were triggering a synchronous DNS request to a slow external service. This blocked the event processing loop for 400 milliseconds per email. With 50 orders per minute, this is catastrophic. Monitoring detected this.
Monitoring also protects your wallet. Cloud bills explode when apps leak memory and restart constantly. Or when inefficient code spins up extra containers because nobody noticed rising CPU utilization.
8 Essential Node.js Metrics to Track
You can’t track everything. That’s just noise. Focus on the metrics that actually tell you something useful.
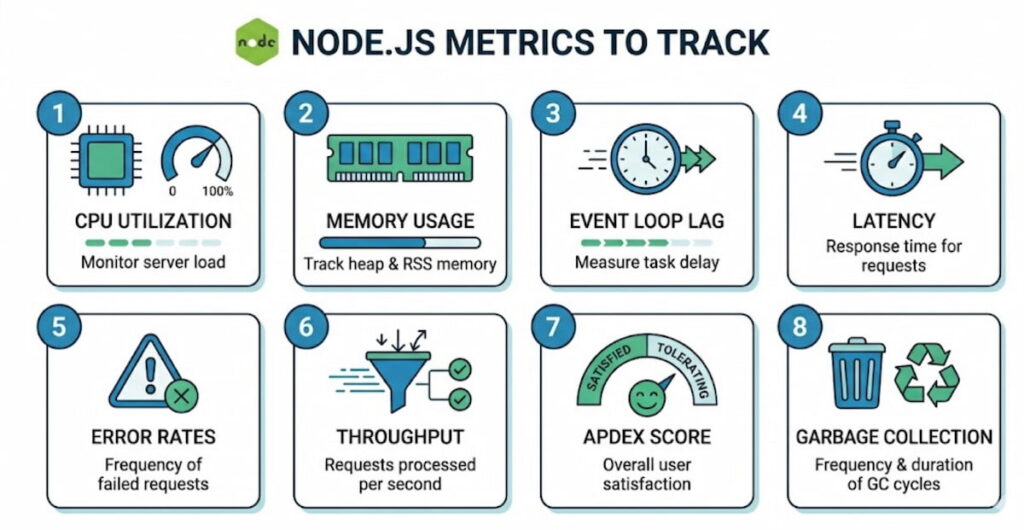
- CPU utilization: Node.js is single threaded for your JavaScript, but libuv uses a thread pool for some I/O. Watch overall CPU, but pay extra attention to the event loop’s main thread. Sustained CPU above 80%? You’ve got a problem;
- Memory usage: Two numbers matter here: RSS (resident set size) and heap used. Watch for steady upward trends. That often means memory leaks. They’re sneaky. A leak might add 10 MB per day. After two weeks, your app crashes at 3 AM. Good luck explaining that to the on call person;
- Event loop lag: This is the big one. Measure how long it takes for a setImmediate or nextTick to fire. Anything over 50 milliseconds is yellow. Over 100 milliseconds is red. High lag means you’re blocking the loop with synchronous work or poorly managed promises;
- Latency: Track both average and percentiles (p95, p99). Average latency hides the truth. If 99% of requests finish in 10 ms but 1% take 10 seconds, your average looks fine. But that 1% of users? They’re tweeting bad things about you;
- Error rates: Not all errors are equal. 404s are fine. 500s are not. Track error rates per endpoint. Watch for sudden spikes or slow climbs. A slow climb might mean an external API is gradually failing;
- Throughput: How many HTTP requests per second can your app handle? This number changes with hardware, network, and code changes. Monitor it to know your capacity limits before traffic surges;
- Apdex score: This stands for Application Performance Index. It’s a ratio of satisfied to frustrated users based on response time targets. An Apdex score of 0.94 means 94% of requests met your goal. Below 0.85? Start worrying;
- Garbage collection: Node.js uses garbage collection automatically. But long GC pauses hurt performance. Monitor GC frequency and duration. Too many young generation collections might mean you’re creating too many short lived objects.
Node.js Performance Monitoring Using Middleware
Here’s a practical approach. You insert monitoring middleware into your Node.js request handling pipeline. This middleware intercepts every incoming request, records start time, attaches tracking IDs, and measures everything that happens afterward.
Why middleware? Because it’s non intrusive. You don’t rewrite your business logic. You just add a few lines in your Express or Fastify setup. The middleware captures transactions, traces database calls, logs outgoing HTTP requests, and bundles all that data into structured events.
For example, your middleware can automatically calculate latency per route. It can tag requests with user IDs or tenant information. It can sample slow requests for detailed analysis while ignoring fast ones. Smart sampling keeps overhead low.
We think the real magic happens when middleware integrates with distributed tracing. In a microservices architecture, a single user action might touch five different Node.js services plus a database and a message queue. Without tracing, you’re guessing where the delay happened. With tracing, you see the whole path.
Middleware can also inject OpenTelemetry instrumentation. That’s the open standard for telemetry data. Once you export traces in OpenTelemetry format, you can send them to any backend that speaks the language. No vendor lock in.
But don’t go overboard. Too much middleware, or poorly written middleware, will slow your app more than it helps. Keep monitoring code lightweight. Use async hooks carefully. And test the overhead in staging before you push to production.
Node.js Performance Monitoring: 8 The Best Practices
Let’s get practical. These are the rules we’ve learned the hard way.
1. Monitor in Production, Not Just Staging
You should monitor in production, not just in staging, because while staging is useful, production is where you’ll encounter real traffic, real data sizes, and real weirdness. That memory leak which only shows up after forty-eight hours of steady load is something you will never catch in a five-minute staging test.
2. Set Alerts With Actual Thresholds
Set up alerts with actual thresholds instead of merely collecting data, and take time to decide what “broken” actually looks like. You might trigger an alert when the error rate exceeds five percent for five minutes, or when the ninety-ninth percentile latency rises above two seconds. Over time, you will need to tune those thresholds, since too many false alarms will cause people to ignore them.
3. Correlate Metrics With Deployments
Correlate metrics with deployments by marking the timeline every time you push code. When you watch your metrics afterward, you will quickly see whether that “tiny refactor” has actually broken something. With this approach, a rollback becomes a one‑click decision rather than a two‑hour debugging session.
4. Use Log Aggregation
Use log aggregation because logs and metrics together are far stronger than either one alone. When a metric goes bad, you can jump straight to the logs from the same time window, find the exception stack trace, and fix the bug, that is the essential loop.
5. Monitor Your Monitoring
Do not forget to monitor your monitoring tools as well, since your APM agent itself consumes CPU and memory. If it uses too many resources, it will distort your numbers, so run benchmarks both with and without monitoring. Aim to keep overhead under five percent for CPU and under one hundred megabytes of memory.
6. Track Security Monitoring Too
Track security monitoring alongside performance, because the two overlap more than you might think. A sudden spike in throughput could indicate a DDoS attack, while a slow rise in error rates might mean someone is probing for vulnerabilities, so you should watch both types of signals together.
7. Don’t Ignore Scalability Testing
Do not ignore scalability testing either, since monitoring tells you what is happening right now while load testing tells you what will happen when traffic doubles. Run both types of tests, and then use monitoring to validate your scaling predictions.
8. Check Your Dependencies
Finally, check your dependencies carefully because Node.js has millions of npm packages, and while some are fast, others are performance hogs. Use monitoring to see which dependencies add latency, since that cute utility library might be performing heavy synchronous work. If so, replace it or cache its output.
Top 5 Node.js monitoring tools
There are dozens of tools out there. These five consistently work well for Node.js teams.
1. New Relic

New Relic has been around forever, and for good reason. It’s an APM powerhouse. The New Relic Node.js integration drops into your app with minimal config. You add their npm package, set your license key, and boom. Instant metrics.
The New Relic Node.js quickstart gets you from zero to dashboard in about ten minutes. It automatically implements Express, MongoDB, PostgreSQL, Redis, and dozens of other libraries. You see transactions broken down by endpoint, database queries, and external calls.
We like how New Relic handles distributed tracing across microservices. You can follow a single request through five different Node.js services plus a load balancer and a database. The UI isn’t the prettiest, but it’s functional. Their alerting engine is solid too.
Pricing can get expensive at scale. But for small to medium apps, the free tier is generous enough to get real value.
2. Datadog

Datadog started as infrastructure monitoring, but their APM is now top notch. Their Node.js agent supports OpenTelemetry natively. You can send traces from your app without changing much code.
The big win with Datadog is unification. Metrics, logs, traces, and real user monitoring all live in one place. You don’t jump between dashboards. When a HTTP request slows down, you click from the trace to the related logs to the host CPU graph in two seconds.
Their event loop monitoring is particularly sharp. They show you lag over time, plus which async operations are pending. That’s rare and valuable.
Downside? Cost. Datadog gets expensive fast. You’ll pay per host, per million log events, per million traces. It adds up. But for teams that need one tool to rule them all, it’s worth considering.
3. Prometheus + Grafana

This is the open source combo. Prometheus scrapes metrics from your Node.js app. Grafana visualizes them. No licensing fees. Total control.
You expose a /metrics endpoint from your app using the prom-client library. Prometheus pulls data every few seconds. Then you build dashboards in Grafana for CPU utilization, memory usage, event loop lag, and everything else.
The learning curve is steeper. You have to set up alerts separately. There’s no built in distributed tracing (though you can add Jaeger or Tempo). But for teams with ops experience, this combo is rock solid and infinitely customizable.
We think Prometheus excels at real-time monitoring of many services. It handles thousands of metrics per second without breaking a sweat. And Grafana dashboards are beautiful.
4. Elastic APM

Elastic’s APM is part of the Elastic Stack (ELK). If you already use Elasticsearch for logs, adding APM is a natural step. Their Node.js agent supports OpenTelemetry and automatic instrumentation.
The killer feature is integration. You search for a slow transaction, click through to the related logs, and see exactly what happened. No manual correlation. No timestamp fiddling.
Elastic APM also handles garbage collection metrics well. You can see GC pauses per minute and which memory pools are growing. That’s critical for tracking down memory leaks.
The agent is open source. The cloud version is reasonably priced. Self hosted is free but you manage the infrastructure yourself.
5. AppDynamics

AppDynamics (now part of Cisco) targets enterprise customers. It’s expensive and complex, but also extremely powerful. Their Node.js agent does deep code level diagnostics. It can tell you which line of which function is slowing down a request.
They excel at business transaction monitoring. You define what matters to your business like “checkout flow” or “login process”. Then AppDynamics tracks those specifically, not just random HTTP endpoints.
For large organizations with compliance requirements, AppDynamics has the best role based access controls and audit logs. But for a small startup? Probably overkill.
Putting it all together
Node.js monitoring isn’t a set and forget thing. You bake it into your development process, you review dashboards during weekly ops meetings, you tune alerts when they get noisy, you add new metrics as your architecture changes.
Start simple. Install an APM agent like New Relic or open source Prometheus client. Track error rates, latency, and event loop lag. Set three alerts. Fix the first thing that breaks. Then expand from there.
Your users won’t thank you for monitoring. They’ll just never notice it because everything works. And that’s the whole point, right? Quietly, boringly, reliably fast. That’s the Node.js way when you do it right.
