Managing IT infrastructure today feels like juggling fire and ice. One part lives in your data center. The other floats across public clouds. Hybrid cloud monitoring bridges this gap. It gives you one unified way to watch performance, security, and costs. Without it, teams fly blind. Outages spread. Budgets blow up. We think this guide will help you understand why monitoring matters more than ever. Let’s start with the basics.
What Is Hybrid Cloud Monitoring
Hybrid cloud monitoring is the practice of tracking performance, availability, and security across hybrid cloud environments. These environments mix on-premises infrastructure with public clouds like AWS, Azure, and Google Cloud. The goal is simple. See everything. From physical servers in your basement to serverless functions running in three regions.
Traditional tools fail here. They were built for static data centers. Now workloads jump between private and public clouds every second. Hybrid cloud monitoring collects metrics from both sides. It stitches them together. Then it shows you what’s working and what’s breaking.
Think of it as a control panel for chaos. You get centralized management for logs, traffic, and alerts. No more logging into five dashboards. Network monitoring becomes unified. You can watch a packet travel from an on-prem firewall to an AWS VPC. Then into an Azure virtual network. Then back. Performance monitoring tracks latency, RTT (Round Trip Time), and jitter across these hops. Security monitoring flags unusual patterns. Maybe a server in your data center is talking to an unknown IP in Google Cloud. Hybrid cloud monitoring catches that.
Key Components of Hybrid Cloud Monitoring
A solid system includes several layers. You cannot afford gaps. Each component plays a specific role. Here is what you need.
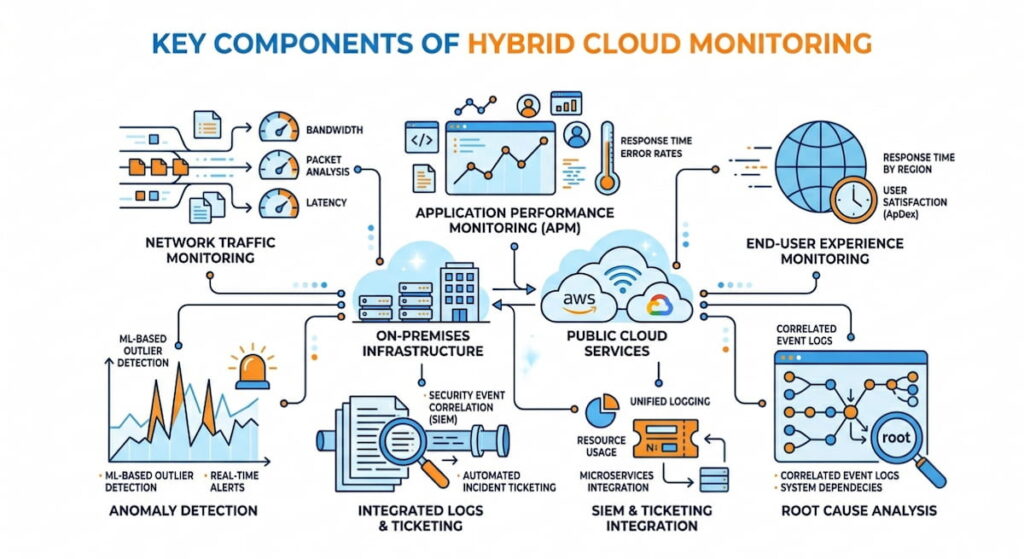
- Network traffic monitoring: This uses protocols like NetFlow, IPFIX, and cloud specific flows. AWS offers FlowLogs. Azure provides FlowLogs for Network Security Groups. Google Cloud has similar telemetry for packet mirroring. These give you raw data on who talks to whom;
- Application performance monitoring (APM): APM tracks user requests from browser to database. Every hop matters. It measures response times, database query speeds, and external API calls. Slow code gets spotted fast;
- End-user experience monitoring: This measures actual page loads. Not synthetic tests. Real customers in real cities. API response times get recorded from mobile devices, desktops, and tablets. You see what they see;
- Container monitoring: Modern hybrid clouds run Kubernetes. Clusters span on-prem racks and public cloud nodes. Container monitoring watches pod to pod communication. It tracks CPU, memory, and network usage inside each container. No black boxes allowed;
- Anomaly detection: Algorithms compare current behavior against historical baselines. A server that usually sends 2MB per hour suddenly pushes 200MB. That gets flagged. We think this is where machine learning actually helps;
- Threat intelligence: External feeds block known bad actors. IP addresses, domain names, and certificate hashes. The list updates constantly. Your monitoring tool consumes these feeds and automatically blocks malicious traffic;
- Root cause analysis: This is your digital detective. Tools trace a slow checkout error back to a congested switch in your own rack. Or maybe a misconfigured firewall rule in AWS. Or a noisy neighbor VM in Azure. The trace shows the exact path;
- SIEM and ticketing integration: All of this feeds into a SIEM (Security Information and Event Management) like Splunk. Or ticketing systems like ServiceNow via REST API. Alerts become tickets automatically. No manual forwarding. No missed incidents.
Each layer depends on the others. Skip one, and your hybrid cloud monitoring has a blind spot. Attackers love blind spots. So do performance gremlins. Build the full stack.
How It Differs From Traditional Monitoring
Old school monitoring assumed your stuff lived in one place. You had an IP range, you owned the cables, you controlled the routers. Now? Your database might be on Azure. Your application logic is on AWS, and your cache is on Google Cloud. A multi-cloud environment complicates matters because each cloud has its own tools: CloudWatch for AWS, Azure Monitor, and Google Cloud Operations Suite. None of them have visibility beyond the cloud. Hybrid cloud monitoring acts as a translator. It pulls data from each cloud’s API. It also talks to your on-prem SNMP agents and flow exporters. The result is a single pane of glass. Some vendors call this “unified observability.” We call it survival.
5 Benefits of Hybrid Cloud Monitoring
Why invest time and money here? The benefits show up on your bottom line. Faster fixes. Lower costs. Happier users. Let’s break it down.
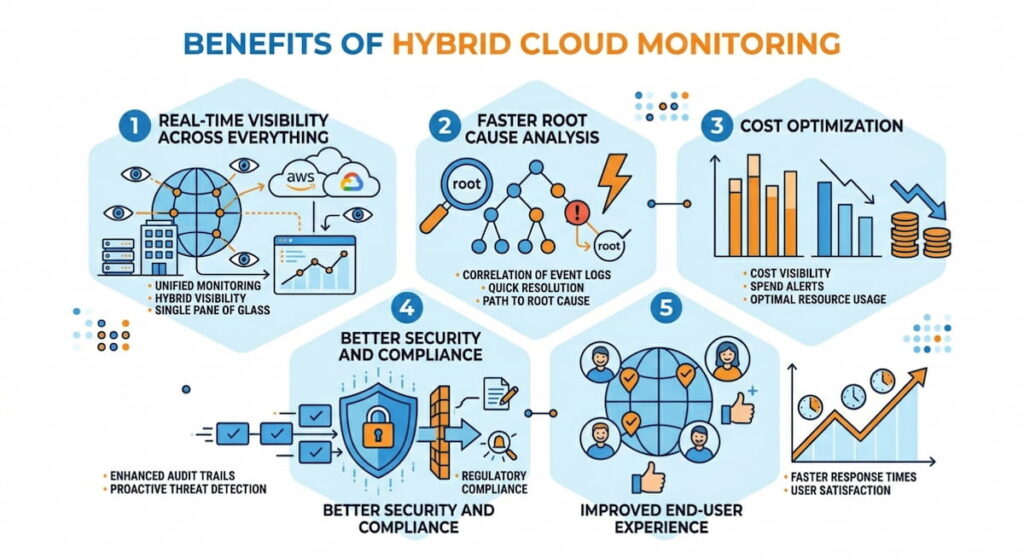
1. Real Time Visibility Across Everything
Real-time visibility means you see problems as they happen. Not five minutes later. Not after a customer complains. A sudden spike in latency between your on-prem database and an AWS Lambda function triggers an alert immediately. You check network visibility dashboards. You see packet loss on a specific VPN tunnel. Fixing takes ten minutes instead of three hours. This matters. Every minute of downtime costs an average of $5,600 per minute, according to Gartner data. Real time monitoring slashes that risk.
2. Faster Root Cause Analysis
Root cause analysis becomes a nightmare without unified data. Teams point fingers. “It’s the cloud.” “No, it’s your firewall.” Hybrid cloud monitoring correlates events across domains. A slow checkout? The tool shows high jitter on the link between Azure and your payment processor. Or maybe container monitoring reveals a memory leak in a Kubernetes pod running on-prem. You fix the actual problem. Not a symptom. This speeds mean time to resolution (MTTR) by up to 40%.
3. Cost Optimization
Cost optimization sounds like a finance term. But monitoring drives it directly. Hybrid cloud monitoring shows you underused resources. An EC2 instance in AWS running at 5% CPU. A reserved instance in Azure that never gets traffic. An on-prem server that could be decommissioned. You also spot data transfer waste. Moving logs between clouds costs money. Monitoring reveals these flows. Some teams cut cloud bills by 30 – 60% just by acting on visibility data.
4. Better Security and Compliance
Cloud security requires constant vigilance. Hybrid cloud monitoring feeds Network Detection and Response (NDR) systems. It detects lateral movement. An attacker compromises a VM in Google Cloud. They try to jump to your on-prem Active Directory. Monitoring sees the unusual cross cloud connection. Anomaly detection flags it. Threat intelligence confirms the destination IP is malicious. You block the traffic automatically. Compliance also gets easier. PCI DSS, HIPAA, and SOC 2 require continuous monitoring. Hybrid tools generate audit ready reports across all environments. Refer to the NIST SP 800-145 definition of cloud computing to understand the compliance boundaries.
5. Improved End User Experience
End-user experience monitoring tracks real transactions. A user in London loads your app. It takes four seconds. Too slow. Monitoring shows the bottleneck. A RTT (Round Trip Time) of 200ms between your AWS load balancer and an on-prem database. You move the database closer. Or add caching. Users get sub second loads. Retention improves. Revenue follows.
Hybrid Cloud Monitoring Best Practices
You can’t just buy a tool and relax. Best practices separate success from expensive chaos. Follow these rules.
Use Standard Flow Protocols Everywhere
NetFlow and IPFIX are your friends. Enable them on all routers, firewalls, and switches. For AWS, turn on VPC FlowLogs. For Azure, enable FlowLogs on Network Security Groups. Google Cloud offers similar packet mirroring. Export all flows to a central collector. This gives you network traffic monitoring without deploying agents on every VM. Flowmon is one example of a tool that excels here. It ingests flows from any source. Then it correlates them with performance metrics.
Integrate With Your SIEM and Ticketing Systems
Your SIEM (like Splunk) wants monitoring data. Your IT service management tool (like ServiceNow) wants alerts. Use REST API integrations. Push anomaly events directly into incident workflows. This closes the loop. A security analyst sees a threat in Splunk. They create a ticket in ServiceNow automatically. The network team gets notified. They investigate using Network Detection and Response (NDR) features. No manual forwarding. No missed alerts.
Monitor East West Traffic, Not Just North South
Most teams only watch traffic to the internet. That’s a mistake. East west traffic (between servers inside your hybrid cloud) carries the biggest risks. A compromised container talks to a database. Malware spreads from one cloud to another. Container monitoring should track pod to pod communication. Network visibility tools must show flows between your Azure VNet and your on-prem VLAN. Ignore this, and you miss the early stages of an attack.
Set Baselines and Automate Anomaly Detection
Don’t chase false positives. First, let your hybrid cloud monitoring system learn normal behavior. For two weeks, it observes. Average latency between AWS and on-prem is 15ms. Typical jitter stays under 5ms. Normal traffic volume peaks at 10am. Then you turn on anomaly detection. Any deviation triggers a lower severity alert first. If deviation persists, escalate. This approach reduces alert fatigue. Engineers actually pay attention.
Correlate Network, Application, and Security Data
Silos kill efficiency. Your network team uses one dashboard. Your app team uses another. Security uses a third. Hybrid cloud monitoring forces correlation. When application performance monitoring shows slow response times, the system checks network RTT (Round Trip Time) simultaneously. If the network is fine, it checks database queries. If the database is fine, it checks security policies blocking a required API call. Flowmon and similar platforms build this correlation natively.
How to Choose Hybrid Cloud Monitoring Solution
The market is crowded. Every vendor promises magic. How do you pick? Use this checklist.
1. Check Multi Cloud and On Prem Support
Your solution must handle AWS, Azure, and Google Cloud natively. Not through half baked integrations. Ask specific questions. Can it ingest VPC FlowLogs from all three clouds? Does it support IPFIX from your existing on-prem routers? Can it monitor bare metal servers? Virtual machines? Containers? If the answer is “we’re working on it,” walk away.
2. Demand Open Protocols, Not Proprietary Agents
Beware of tools that require installing a custom agent on every server. That model doesn’t scale to thousands of containers. Look for NetFlow, IPFIX, FlowLogs, Monitor Us and REST API support. Open protocols mean you can change vendors later. You aren’t locked in. The IETF’s IPFIX specification is the gold standard here.
3. Verify Real Time Capabilities
“Real time” means different things. Some tools update every five minutes. That’s not real time. Ask for sub minute granularity. Your hybrid cloud monitoring should show latency, RTT, and jitter within seconds of change. For security, you need immediate anomaly detection. A crypto miner spinning up on a stolen AWS key should trigger an alert in under 30 seconds. Test this during a trial.
4. Evaluate NDR and Security Features
Network Detection and Response (NDR) is not optional. Your monitoring tool should detect known attack patterns. It should also spot weird behavior. A server that normally sends 1MB of traffic per hour suddenly sends 100MB. That’s a data exfiltration attempt. The tool must integrate with threat intelligence feeds. And it should allow automated responses like blocking an IP on your firewall via API.
5. Test Scalability and Cost
Scalability matters more than you think. Your hybrid cloud will grow. New accounts, new regions, new clouds. The monitoring tool must handle 10,000 flow exports per second without dropping packets. Ask for reference customers at your scale. Also watch pricing. Some vendors charge per flow. Others charge per monitored host. Cost optimization applies to the monitoring tool itself. Estimate your total cost at double your expected usage.
Challenges of Hybrid Cloud Monitoring
Honestly, no solution is perfect. You will hit obstacles. Knowing them ahead of time helps you plan.
Data Volume and Noise
A single AWS VPC can generate millions of VPC FlowLogs per hour. Add Azure FlowLogs, add on prem NetFlow, add application logs, add security events. The volume is staggering. Many tools drown. They drop packets, they slow down, they burn CPU. You need a solution with efficient storage and sampling options. Not every packet needs saving. Smart aggregation reduces noise. But configure it wrong, and you lose critical evidence. Start with high level summaries. Drill down only when investigating an incident.
Skill Gaps
Your team probably knows AWS or Azure. Not both. On prem networking is a third specialty. Hybrid cloud monitoring requires people who understand all three. That’s rare. Small shops struggle. We think you should invest in cross training. One week of deep dives into network visibility for cloud engineers. One week of cloud networking for on prem teams. Also choose a tool with good documentation and support. Flowmon offers training, for example. Without skills, your expensive monitoring platform becomes a paperweight.
Tool Sprawl
Many companies end up with five monitoring tools. One for AWS, one for Azure, one for on prem, one for security, one for APM. None talk to each other. Engineers waste hours switching tabs. Hybrid cloud monitoring should replace sprawl, not add to it. But migrating off legacy tools is painful. Legacy systems have custom scripts. They have hardcoded dashboards. They have political owners. Phase the migration. Run old and new in parallel for three months. Then cut over. Expect resistance.
Latency in Cross Cloud Visibility
Ironically, monitoring a hybrid cloud introduces its own latency. Data has to travel from your on prem routers to a central collector. Then to a cloud hosted dashboard. Then to your browser. That takes time. For real time alerting, you need collectors deployed close to your data. Place a collector in each cloud region. Place another in your data center. Aggregate results to a master console. This distributed architecture reduces RTT (Round Trip Time) for monitoring data. It also adds complexity. Manage carefully.
Encryption and Blind Spots
More and more traffic is encrypted using TLS 1.3, WireGuard, and VPN. This is good for security, but bad for network monitoring. Traditional packet sniffing only sees encrypted data.
NetFlow and IPFIX still work because they read packet headers, not contents. But deep anomaly detection becomes harder. You can’t inspect a malware download inside an encrypted flow. Some solutions use TLS decryption proxies. Those introduce privacy and performance issues. Others rely on endpoint agents. Choose your tradeoff. Know that hybrid cloud monitoring will have blind spots. Plan other controls like host based detection to fill them.
Integration Headaches
Your SIEM (maybe Splunk) expects data in a certain format. Your ticketing system (ServiceNow) expects another. REST API rate limits can block bulk exports. Some cloud providers throttle FlowLogs delivery. You’ll spend weeks writing parsers and transformers. We recommend buying a platform that includes pre-built integrations. Flowmon integrates with Splunk and ServiceNow out of the box. If you roll your own, budget integration time as half your project timeline. It always takes longer.
Keeping Up With Cloud Changes
AWS releases dozens of new services every year. Azure and Google Cloud do the same. Your hybrid cloud monitoring vendor must keep pace. A new AWS service like EKS Anywhere (Kubernetes on your own hardware) needs immediate support. Otherwise you have a blind spot. Ask vendors about their update cadence. Monthly? Quarterly? Never? Choose a vendor that treats cloud updates as a competitive advantage. They should release new integrations within 30 days of a cloud provider’s launch.
