Modern IT infrastructure has a specific problem. That problem is multi-cloud monitoring. Very few organizations rely on a single data center these days. They actively spread workloads across AWS, Microsoft Azure, and Google Cloud to dodge vendor lock-in and squeeze out better performance. Multi-cloud monitoring is simply the disciplined act of getting unified visibility across those different platforms. It sounds reasonable on paper. The real execution? It gets messy fast.
Without a dedicated strategy, teams lose track of application performance and resource utilization. They drown in alerts from fragmented tools that refuse to talk to one another. This article breaks down what you actually need to know. We look at the necessary tools, the ugly challenges, and the best practices that work.
What is Multi Cloud Monitoring
Let us skip the marketing fluff. Multi-cloud monitoring refers to the use of a unified monitoring platform to track infrastructure health, security, and application speed across two or more public clouds. This is different from “hybrid cloud” monitoring, which usually focuses on connecting a private data center to a single public cloud. Multi-cloud implies a choice. You might run Kubernetes containers on Google Cloud, databases on AWS, and .NET apps on Microsoft Azure. Each has its own native tool like AWS CloudWatch or Azure Monitor. Those native tools are great for their specific backyard, but they create walls.
The core goal of multi-cloud monitoring is to break down those walls. It aims to provide a centralized dashboard where an engineer can see a latency spike in Google Cloud and immediately trace it to a misconfigured load balancer on AWS. It requires standardizing data collection across environments that were never designed to be standardized.
Think of it as learning three different languages fluently so you can translate them all into one master document. You need observability, which goes beyond simple uptime checks. Observability lets you ask unknown questions about the system’s internal state based on the data it emits. According to HashiCorp’s first State of Cloud Strategy Survey, 76% of organizations are already using more than one public cloud provider, and that number is projected to hit 80%. If you are not monitoring across those gaps, you are flying blind. You might think you have control, but maybe you are just reacting to fires in one silo while another burns down.
5 Necessary Multi Cloud Monitoring Tools
Selecting the right tools is like choosing a pit crew for a race car. You need speed, precision, and perfect coordination. No single vendor does everything perfectly, but a unified monitoring platform is non-negotiable. Here are the categories and specific solutions that actually move the needle.
1. Dynatrace Hybrid Cloud Monitoring
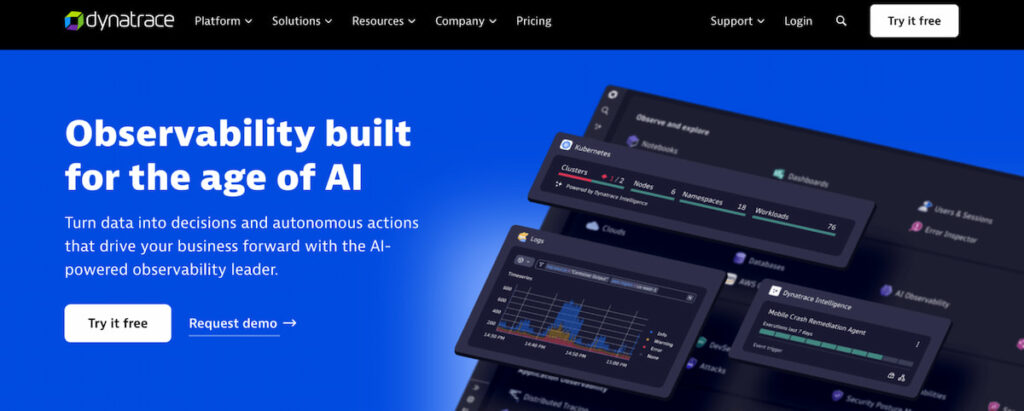
Dynatrace delivers AI-powered observability that spans hybrid environments with automatic discovery. Companies use it to monitor applications running on Kubernetes clusters alongside legacy on-prem systems. The platform cuts mean time to resolution through causal AI that links problems across layers. Enterprises report fewer alert storms after switching to its full-stack approach. Some teams notice immediate drops in noisy notifications.
2. Datadog Hybrid Cloud Monitoring
Datadog offers a flexible SaaS platform built for dynamic infrastructures that cross cloud boundaries. Teams collect metrics logs and traces from AWS instances and private servers in the same dashboard. Its vast integration library now covers over 1,000 technologies which smooths out mixed setups. Organizations scale monitoring without heavy manual configuration thanks to its agent-based and agentless options. Plenty of shops expand coverage quickly this way.
3. New Relic Hybrid Cloud Monitoring
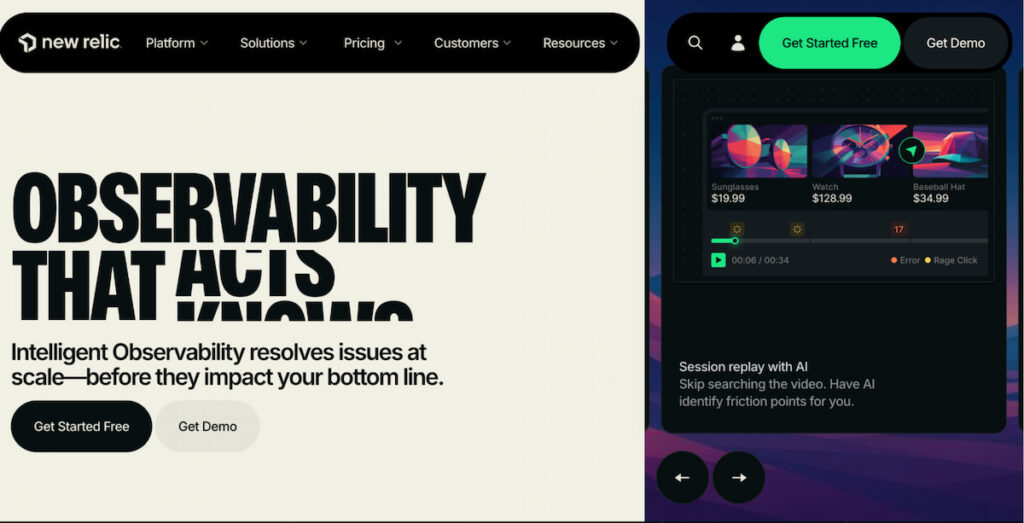
New Relic focuses on full-stack observability with easy instrumentation for applications in hybrid landscapes. Users gain real-time insights into user experience alongside infrastructure health across public and private clouds. The tool simplifies complex queries so engineers spend less time hunting data. Many medium to large teams appreciate its balance of depth and usability. Queries that once took hours now finish in minutes for some.
4. Splunk Observability Hybrid Cloud Monitoring
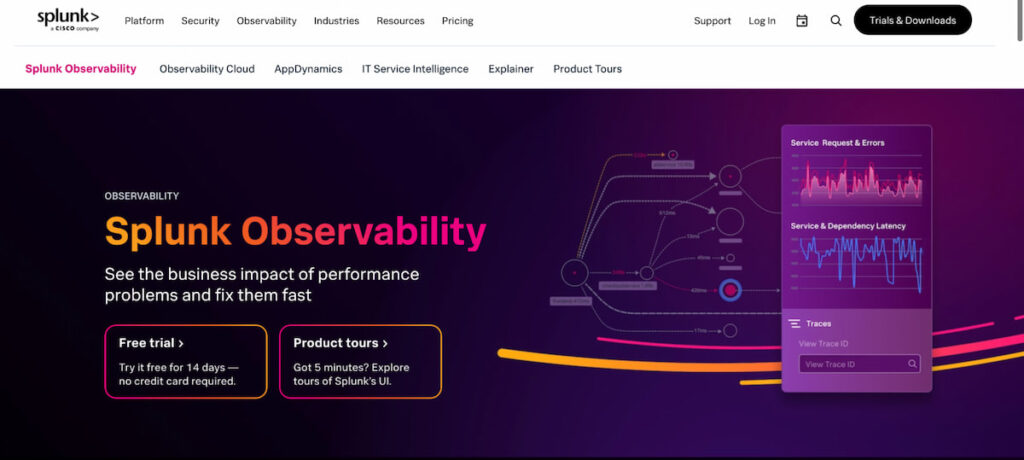
Splunk Observability excels at ingesting and analyzing massive volumes of machine data from diverse hybrid sources. Security teams pair it with performance monitoring to spot threats hidden in logs. The platform supports both cloud-hosted and on-premises deployments which fits organizations with strict data residency rules. Its search capabilities turn raw events into actionable intelligence fast. Complex queries feel almost conversational once users get comfortable.
5. ScienceLogic Hybrid Cloud Monitoring
ScienceLogic provides a single pane of glass for infrastructure that includes servers storage and network gear in hybrid setups. Its AI platform correlates events across public clouds and on-prem devices to surface root causes. Users configure custom dashboards that update in real time without constant refreshes. Large enterprises value the broad device support that reduces tool sprawl. Fewer consoles mean less context switching during incidents.
Key Challenges Multi Cloud Monitoring
Let’s be honest: the road to multi-cloud visibility is paved with broken APIs and alert fatigue. It is not just difficult; it is operationally expensive if done wrong.
Tool Sprawl and Data Silos
This is the number one complaint we hear. Infrastructure teams use one tool for networks, DevOps uses another for containers, and security uses a third for threats. This fragmentation forces engineers to play detective during an outage. They waste precious seconds (which turn into hours) switching tabs and trying to match timestamps. One recent study highlights that without consolidation, teams face “alert blindness” where critical incidents get buried under hundreds of low-priority notifications .
Inconsistent Data Formats
AWS measures CPU usage one way; Azure does it another. If you try to compare “CPU utilization” across both using raw data, you are comparing apples to screwdrivers. Data normalization is the technical process of converting these disparate formats into a standard schema. Without it, your centralized dashboard will show gibberish. You cannot run predictive analytics on data that does not match.
The Compliance Nightmare
If you store data in Europe on Google Cloud and process it in the US on AWS, which GDPR rules apply? Both. Compliance checks become exponentially harder. You need to ensure encryption standards are met on every platform. For healthcare, HIPAA requires tracking every access log. For finance, PCI-DSS demands specific network segmentation. A misconfiguration in a single cloud bucket can cost millions in fines.
High Latency and Network Complexity
When an app on Microsoft Azure talks to a database on AWS, the network path is public internet (unless you pay for direct connection). Performance monitoring must account for this cross-cloud lag. Sometimes the app is fine, but the cloud-to-cloud connection is dropping packets. Traditional tools cannot see that middle ground.
5 Best Practices in Multi Cloud Monitoring
You have the tools, and you know the pitfalls. Now, how do you actually succeed? You need rigid discipline and a shift in culture.
1. Standardize with OpenTelemetry
Stop building custom scripts for every vendor. Embrace OpenTelemetry. It is an open-source standard for generating and collecting telemetry data. It acts as a universal translator. You install one agent, and it sends data to your backend, regardless of whether the workload is on-prem, AWS, or Azure. This solves data collection and normalization in one swoop.
2. Build a Centralized Dashboard
You need a “single pane of glass,” but don’t cram everything onto one screen. A good centralized dashboard uses layers. The top layer shows business KPIs (revenue impact). The middle layer shows application performance. The bottom layer shows raw infrastructure. This structure allows the CTO to see the summary and the engineer to click into the log aggregation for a specific server.
3. Implement Automated Remediation
Monitoring is useless if you still need a human to click “reboot.” You must build automation and self-healing mechanisms into your workflow. For example, if disk space exceeds 85% on a Google Cloud VM, an automated script should trigger a cleanup or request more storage. If latency spikes, traffic should auto-route to a healthy region. This reduces the mean time to resolution (MTTR) from hours to seconds. According to Google Cloud’s SRE handbook, automating remediation is a core principle of reliable systems.
4. Integrate Real-time Compliance Monitoring
Do not wait for an auditor to tell you you failed. Set up real-time compliance monitoring. Use tools like Palo Alto Networks Prisma Cloud to continuously scan your storage buckets. If someone accidentally makes a HIPAA-relevant bucket public, the tool should lock it down instantly and page the security team. This is how you move from reactive security to proactive governance.
5. Adopt a FinOps Culture
Cost optimization is a monitoring metric, just like latency. Tag every resource you spin up. Use CloudHealth by VMware to create chargeback reports. If the marketing team spins up an expensive database on Azure, they should see the cost immediately on their dashboard. Financial accountability drives efficiency better than any technical limit ever will.
Multi Cloud Monitoring Trends
The future of monitoring is predictive, not reactive. Several trends are reshaping how we look at observability.
AI-Driven Analytics and Predictive Operations
We are moving past simple dashboards. AI-driven analytics are now ingesting historical data to predict failures before they happen. Imagine your system flagging a Google Cloud disk for failure 48 hours in advance because it detected a specific vibration pattern in the latency data. Predictive analytics allows teams to shift from “firefighting” to “prevention.” Analysts predict that AI-driven anomaly detection will become standard, automatically learning what “normal” looks like for your specific traffic patterns and ignoring the noise .
Auto-Ops (Automated Operations)
The next step beyond automation is Auto-Ops. This is where the system not only detects the problem but executes a complex automated remediation strategy without human input. For example, if an AWS region goes down, the AI automatically updates DNS records, spins up containers in a backup region, and notifies stakeholders. This level of self-healing is becoming a requirement for DevOps teams stretched too thin .
Convergence of Monitoring and Security (SecOps)
You cannot separate performance from security anymore. Security monitoring and observability are merging. The same tools that track application performance will soon be used to detect cryptojacking or data exfiltration. Monitor Us (User Experience Monitoring) will merge with identity threat detection. If a user in Japan has a slow login time, the system will check if that is a network issue or a brute-force attack.
Edge Computing Monitoring
As workloads move to the edge, traditional centralized agents fail. New tools are emerging that use lightweight collectors to monitor IoT devices and local edge nodes. These tools must handle intermittent connectivity and store data locally until the network returns.
Key Takeaways
- Unified Visibility is Non-Negotiable: Multi-cloud monitoring requires a centralized dashboard that aggregates data from AWS, Azure, and Google Cloud to eliminate silos;
- Standardize Your Data: Use OpenTelemetry for data normalization. Without standard formats, your observability tools will produce conflicting insights;
- Automate to Survive: Manual response is too slow. Implement automated remediation and self-healing mechanisms to handle routine incidents without human intervention;
- Security is Part of Monitoring: Integrate security monitoring and compliance checks (GDPR, HIPAA) into your daily operational dashboards, not just quarterly audits;
Watch for AI Predictions: The trend toward predictive analytics and AI-driven analytics will shift your team from reactive troubleshooting to proactive prevention.
