You cannot fix what you refuse to measure. That old saying lands hardest when CI/CD pipeline monitoring is missing from your software delivery process. Modern engineering teams push code dozens of times per day. They depend on CI/CD pipelines to automate everything from the first commit to the final production release.
But here is the problem. Without proper CI/CD monitoring, those pipelines become black boxes. Code goes in. Stuff happens. Nobody knows where the stuff breaks. CI/CD pipeline monitoring is simply the practice of collecting, visualizing, and acting on data from every stage of your automated delivery workflow. It turns guesswork into hard numbers. Maybe you think you know where your pipeline slows down. We think you are probably wrong until you start measuring.
What is CI/CD Pipeline Monitoring
Let us define this clearly. CI/CD pipeline monitoring means watching every step of your Continuous integration and Continuous delivery workflow. You track success rates, durations, and failure points across the entire journey from code commit to live application.
Continuous integration is the first half. Developers push code to source control many times a day. Automated builds and tests run against each commit. This catches bugs early. Continuous delivery takes over after the tests pass. It automatically deploys the validated code to staging environments and eventually to production.
CI/CD monitoring sits on top of both. It collects metrics like how long the build phase takes, it counts how many test and validation steps fail. It measures the time code waits in queue time before agents become available.
The difference between basic logging and true observability matters here. Logging tells you something failed. Observability lets you ask why it failed and what happened three steps earlier. A good CI/CD monitoring setup gives you dashboards that show real time status for every pipeline stage. You see the bottleneck immediately. Maybe the build stage is fine but the staging deployment keeps timing out. That is actionable data.
According to the State of DevOps Report from Google Cloud, elite performers deploy roughly 182 times more frequently than low performers. They also have approximately 127 times faster lead time from commit to deploy. Those numbers are not accidents. They come from disciplined practices around CI/CD, automation, observability, monitoring, and constant refinement.
Benefits of CI/CD Pipeline Monitoring
Why should you invest time and tooling into this? The benefits show up in your revenue and your team’s sleep schedule.
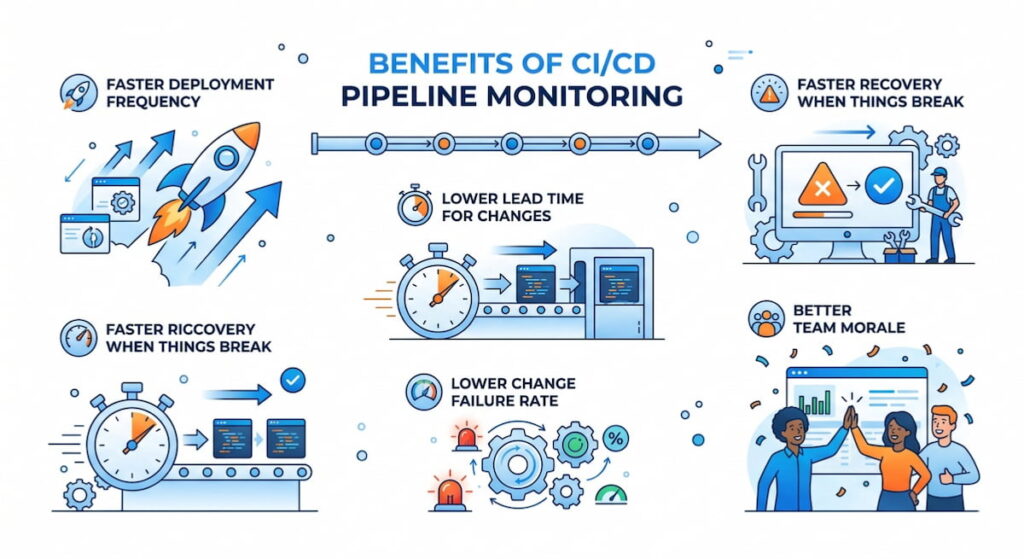
Faster Deployment Frequency
You cannot improve what you do not measure. Deployment frequency tells you how often you ship value to users. With proper monitoring, you spot the friction points. Maybe the security scan runs too slowly. Maybe the database migration step is serialized when it could be parallel. Fix those, and you ship more often.
Lower Lead Time for Changes
Lead time for changes measures the gap between code commit and code running in production. Short lead times mean fast feedback loops. When you monitor each pipeline stage, you see exactly where time gets wasted. A two hour queue time waiting for test agents? That is an easy fix. Add more agents or optimize the test suite.
Faster Recovery When Things Break
Mean Time To Recovery (MTTR) is how long it takes to restore service after a failure. Good monitoring helps you roll back faster or push a fix faster. You know which commit caused the problem. You know which pipeline stage passed the bad code. This cuts MTTR from hours to minutes.
Lower Change Failure Rate
Change failure rate is the percentage of deployments that cause a failure requiring immediate fix. Elite teams have a change failure rate below 15%. Poor monitoring pushes that number above 45%. When you watch your CI/CD pipelines closely, you catch failures in staging before they ever hit production.
Better Team Morale
Nobody likes being paged at 3 AM. Automated alerting catches problems before customers complain. Engineers trust the pipeline. They stop fearing the deploy button. That psychological safety translates directly to productivity. According to Google’s DORA research, high-performing teams report significantly lower burnout rates.
We think the biggest hidden benefit is compliance. A well monitored pipeline creates an automatic audit trail. You can prove who changed what, when, and whether the tests passed. Auditors love that.
6 Common CI/CD Issues
Your pipeline will break. That is a fact of life. Here are the usual suspects that CI/CD monitoring helps you catch early.
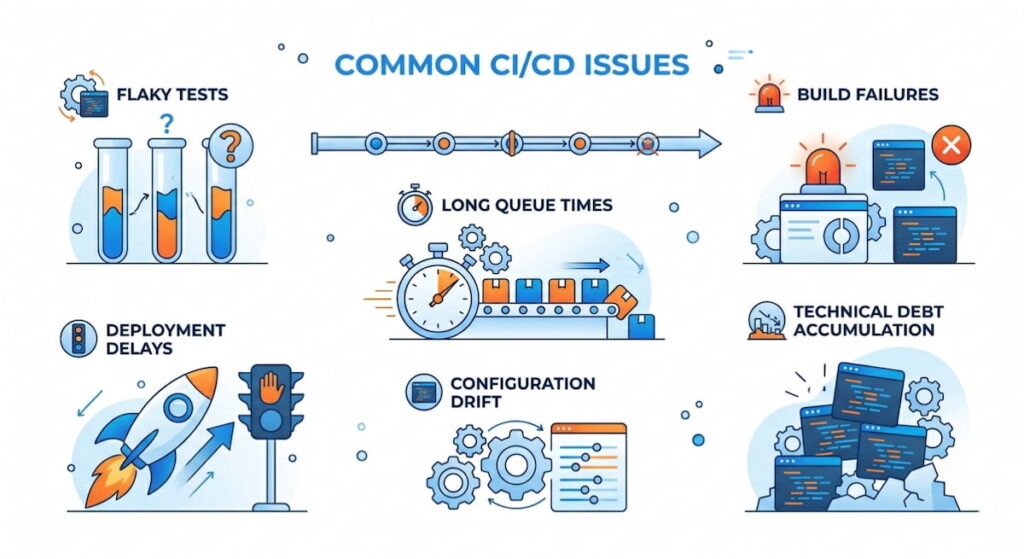
1. Flaky Tests
Nothing destroys trust faster than flaky tests. These pass sometimes and fail other times for no clear reason. Developers waste hours re-running builds. They start ignoring test failures because “maybe it will pass next time.” That is dangerous. Flaky tests hide real bugs. Monitoring shows you which tests have inconsistent results. You can quarantine or fix them.
2. Long Queue Times
Your test agents are all busy. New jobs sit waiting. Queue time silently kills deployment frequency. Developers sit idle. Deployment velocity drops. The fix is usually more agents or better resource allocation. But you need monitoring to prove the problem exists first.
3. Build Failures
Broken dependencies. Syntax errors. Missing environment variables. The build stage fails for a hundred small reasons. Monitoring tells you exactly which commit broke the build. It also shows patterns. Does the build fail every Monday morning? Someone forgot to update a dependency over the weekend.
4. Deployment Delays
Deployment delays happen when a pipeline stage takes too long. Maybe the staging environment is underpowered, maybe a migration script runs slowly, maybe a third party API call times out. Monitoring breaks down the duration for each pipeline stage. You find the slow step and optimize it.
5. Configuration Drift
Your staging environment works perfectly. Production fails anyway. That is configuration drift. The two environments are not identical. Monitoring across pipeline stages reveals these differences. You see that staging uses a different database version or different memory limits.
6. Technical Debt Accumulation
Technical debt is the cost of taking shortcuts. In CI/CD pipelines, debt shows up as brittle scripts and manual steps. Monitoring reveals the same manual intervention happening repeatedly. That is a signal. Automate that step or refactor the pipeline.
Key Metrics of CI/CD Pipeline Monitoring
You cannot watch everything. Focus on these four DORA metrics plus supporting indicators. They form the backbone of any serious CI/CD monitoring strategy.
The Four DORA Metrics
| Metric | What It Measures | Why It Matters |
|---|---|---|
| Deployment frequency | How often you deploy to production | Higher is better for most teams |
| Lead time for changes | Time from commit to deploy | Shorter means faster feedback |
| Mean Time To Recovery (MTTR) | Time to fix a broken deployment | Shorter means better resilience |
| Change failure rate | Percentage of bad deployments | Lower means higher quality |
Supporting Metrics You Need
- Queue Time: Time jobs wait for available agents. High queue time means you need more infrastructure or better scheduling;
- Test Coverage: What percentage of your code runs through automated tests? Low test coverage predicts high change failure rates. Aim for 70% or higher on critical paths;
- Flaky Test Rate: The percentage of test runs that produce inconsistent results. Anything above 5% is a problem. Fix or remove flaky tests;
- Pipeline Stage Duration: Break down time per stage: source control fetch, build, test and validation, staging deploy, production release. The longest stage is your bottleneck;
- Runtime Performance: After deployment, does the app actually work? Runtime performance metrics like response time and error rate belong in your CI/CD monitoring dashboard too. Deployment is not done until the app proves it is healthy;
- Application Logs: Structured application logs from staging and production should feed back into your pipeline monitoring. A spike in errors after deployment means rollback immediately.
7 The Best Practices for CI/CD Pipeline Monitoring
These practices separate teams that monitor from teams that actually improve. Follow them.
1. Start with One Pipeline Stage
Do not monitor everything at once. Begin with the build stage. Get that stable. Then add test and validation, then staging, then production was released. Incremental wins build momentum.
2. Create a Single Source of Truth
Engineers should not check five different tools to understand pipeline health. Build dashboards that aggregate metrics, traces, and application logs into one view. Monitor Us (user experience monitoring) belongs here too. If real users suffer, the pipeline fails regardless of what the tests say.
3. Set Automated Alerting Rules
Do not rely on humans watching dashboards. Configure automated alerting for:
- Pipeline duration exceeding a threshold (say, 15 minutes for a full run);
- Consecutive test failures (three in a row signals a real problem);
- Queue time longer than two minutes;
- Any production release that increases error rates by 10%.
4. Test Your Alerts
This sounds obvious. Nobody does it. Send a fake alert every week. Verify the right people get notified. Check that the runbook actually works. Silence is the enemy.
5. Use Trace Context
Propagate a unique ID from commit through pipeline stages all the way to application logs in production. This is called trace context. When a user reports a bug, you trace that request back to the exact pipeline run and commit. Game changer.
6. Embed Platform Engineering Principles
Platform engineering means treating your CI/CD pipeline as a product. Your internal users are the developers. Monitor their experience. Are they waiting? Are they confused? Build internal dashboards showing pipeline health for each team.
7. Review Metrics Weekly
Gather the team every Monday for 15 minutes. Look at last week’s deployment frequency and lead time for changes. Discuss one bottleneck. Assign one fix. Small improvements compound.
CI/CD Pipeline Monitoring Essential Tools
The tool landscape is crowded. Here is the shortlist organized by category. Pick based on your team size and existing stack.
- GitHub Actions: Deep integration with GitHub repositories. Built-in dashboards show workflow run history and duration. Supports automated alerting via email or Slack. Limited for complex multi stage pipelines but excellent for small to medium teams;
- GitLab CI: One of the most complete offerings. GitLab provides metrics for pipeline duration, queue time, and test coverage. The value stream analytics dashboard shows lead time for changes automatically. We think this is the best all in one option;
- Jenkins: The old workhorse. Jenkins requires plugins for serious CI/CD monitoring. The Blue Ocean plugin gives modern dashboards. The Prometheus plugin exports metrics for external visualization. Jenkins is flexible but demands maintenance;
- CircleCI: CircleCI provides detailed insights into pipeline performance. You see exactly how long each job takes. The test splitting feature reduces queue time by running tests in parallel automatically. Pricing gets expensive at scale;
- ArgoCD: The standard for Kubernetes deployments. ArgoCD monitors sync status and application health. It shows drift between git and live clusters. Best paired with a metrics scraper like Prometheus;
- Flux: Alternative GitOps tool with less visualization than ArgoCD. Flux works well with observability stacks like Grafana. It pushes metrics about sync frequency and failure rates;
- Spinnaker: Netflix’s open source multi cloud CD platform. Spinnaker includes canary analysis and automated rollback. The monitoring features are mature but complex to operate;
- Terraform: Used to provision pipeline infrastructure itself. Monitor Terraform runs separately. Failed Terraform means your pipeline agents stop working. Store state remotely and log every application.
Do not buy everything at once. Start with your CI/CD platform’s native monitoring (GitHub Actions or GitLab CI). Add a dedicated observability backend when you need cross platform correlation. Use Terraform to version control your monitoring configuration. That way your monitoring code is as tested as your application code.
