Serverless monitoring is not optional. It is survival. When you run code on AWS Lambda, Google Cloud Functions, or Azure Functions, you give up control of the underlying machine. That sounds freeing. It is. Until something fails. You cannot SSH into a function. You cannot install an agent. The function runs, logs, then disappears. This is where serverless monitoring enters the picture. It provides visibility without permanent infrastructure. Let us break down exactly what that means, why it is hard, and how to do it right.
Takeaways for busy readers:
- Serverless monitoring tracks functions that vanish after execution. No servers to log into;
- Traditional tools break here. You need granular, per-invocation visibility;
- Cold starts, distributed tracing, and cost spikes are the top three headaches;
- Best practice starts with structured logging and ends with automated alerting on duration;
- Choose a tool that supports OpenTelemetry. Vendor lock in is real.
What is Serverless Monitoring
Serverless monitoring is the practice of observing, tracing, and debugging application code that runs in ephemeral containers. Think of a Lambda function. It spins up, executes a request, and shuts down within milliseconds. Traditional monitoring tools expect long running virtual machines with steady metrics streams. They choke on serverless.
3 Core Metrics for Serverless Monitoring
So what does serverless monitoring actually capture? Three things:
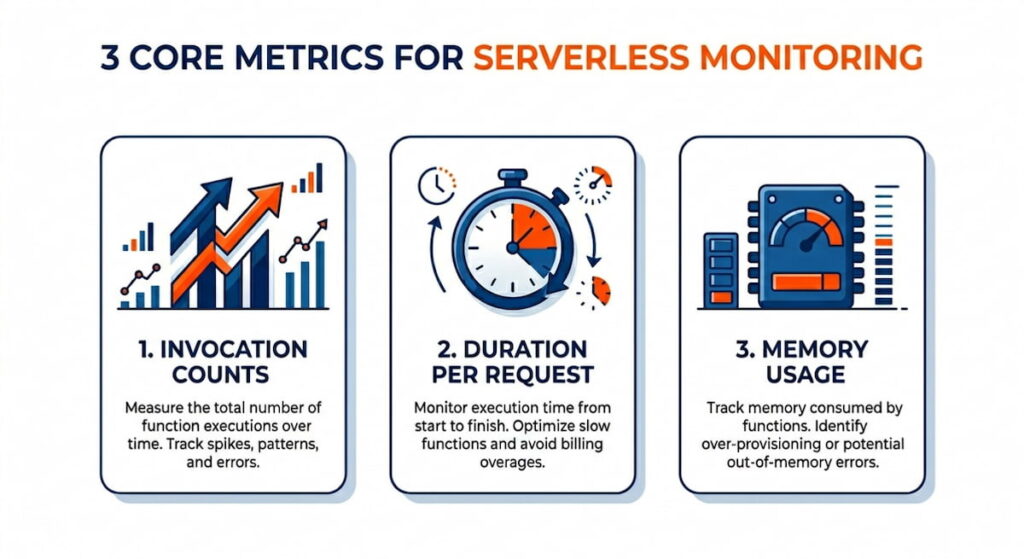
That is the bare minimum. Better systems also capture cold start frequency. A cold start happens when your function has not been used for a while. The cloud provider loads your code from scratch. That adds latency. Sometimes 200 milliseconds. Sometimes two seconds. Your users feel that.
Serverless monitoring also tracks errors. But errors look different here. A function might retry automatically. That hides the failure. Or it might fail silently and log to CloudWatch with no alert. You need a monitoring layer that aggregates those logs, extracts stack traces, and ties each error to a specific invocation ID.
Here is the kicker. Serverless monitoring must be distributed. Your function calls a database. That database is called an API. That API writes to a queue. Without distributed tracing, you see ten healthy functions and one broken user experience. Monitoring in this world is not about watching a CPU graph. It is about reconstructing a request’s entire journey across dozens of stateless pieces.
Monitoring Serverless Applications Effortlessly
Effortless monitoring sounds like a marketing lie. But it is possible. The secret is observability driven development. You bake monitoring into the function code from day one. No retrofitting.
Do not write “User logged in.” Write JSON.
json
{“event”: “login”, “userId”: “123”, “durationMs”: 45, “coldStart”: false}
Why JSON? Because your monitoring tool can search, filter, and alert on any field. Plain text logs are dead data. JSON logs are a queryable database.
Use Automatic Instrumentation
Next, use automatic instrumentation. Most cloud providers offer a wrapper. Your options include:
These libraries inject trace IDs automatically. They measure function duration without extra code. They capture memory usage and log streams. You add one line to your handler. That line does twenty things. Effortless? Close enough.
Smart Sampling Saves Money
Third, sample intelligently. You cannot trace every invocation. That would cost too much. So follow this sampling strategy:
- Sample 1% of requests for deep tracing;
- Sample 100% of errors;
- Sample 100% of slow requests over a threshold, say 500 milliseconds.
This hybrid sampling gives you full visibility where it matters and low cost where it does not.
Alerts Over Dashboards
Real time dashboards are overrated. Do not stare at graphs. Set alerts instead. Your alert priorities:
- Alert when error rate exceeds 1% over five minutes;
- Alert when duration p95 crosses 300 milliseconds;
- Alert when cold start ratio jumps above 10% during peak traffic.
Then fix the root cause. Monitoring that requires human eyeballs is failed monitoring.
Challenges of Serverless Monitoring
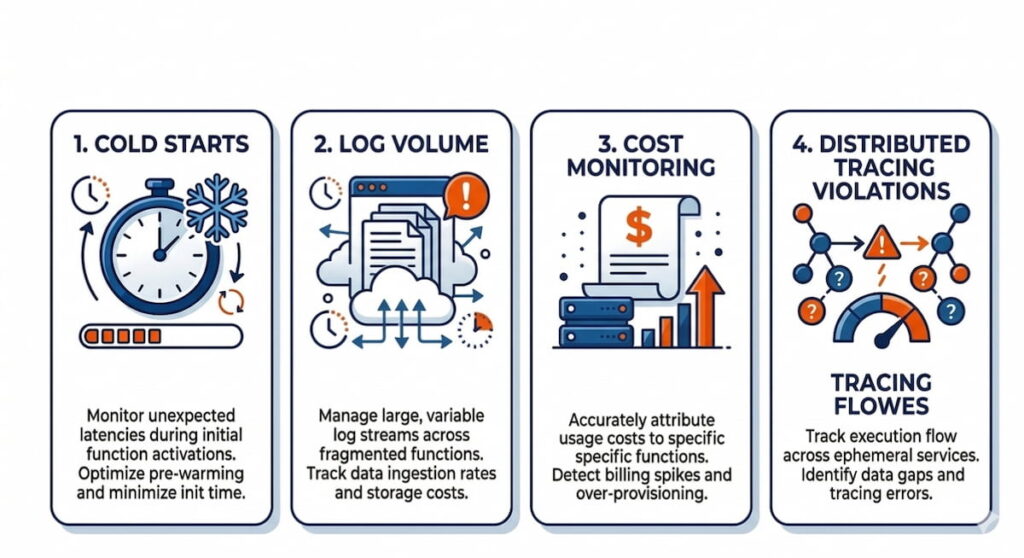
Let me list the pain points. There are many.
Cold Starts
Cold starts are the first monster. Your function runs fast. Then it sits idle for ten minutes. The next invocation triggers a cold start. Your monitoring shows a latency spike. But which request caused it? Was it the first request after a deployment? After a scale to zero? You cannot tell without per invocation timestamps broken down by init duration and response duration. Most tools lump them together. Bad tools hide cold starts. Good tools expose them.
Distributed Tracing Violations
Distributed tracing is challenge number two. Serverless functions call each other. Consider this chain:
- Function A calls Function B via an HTTP trigger;
- Function B writes to S3;
- That S3 event triggers Function C.
Traditional tracing expects a single thread. Serverless tracing expects event driven chaos. You need a trace ID that survives HTTP headers, queue messages, and storage events. OpenTelemetry helps. But setting it up across three cloud services is painful.
Cost Monitoring
Cost monitoring is the third surprise. Serverless bills per millisecond of compute and per invocation. A runaway function with a loop can cost five hundred dollars in one hour. I have seen it happen. Your monitoring must track:
- Cost per function version;
- Cost per customer;
- Cost per region.
Some tools estimate real time cost. Others show you a bill thirty days later. By then the damage is done.
Log Volume
Log volume is the silent killer. Each function invocation writes logs. Each log line costs storage and query time. A busy system might generate millions of logs per hour. Your monitoring tool will either drop logs (bad) or charge you a fortune (also bad). You need:
- Log sampling rules;
- Deletion policies for logs older than thirty days.
Forever retention is not monitoring. It is hoarding.
Serverless Monitoring Best Practice
Best practices come from burned hands. Here is what works.
1. Use the Strangler Pattern for Migration
Implement the strangler pattern for monitoring. Do not migrate all functions at once. Pick one critical function. Add structured logging, distributed tracing, and error alerting. Run it for a week. Measure the overhead. Then expand to the next function. This gradual approach catches configuration mistakes before they spread.
2. Tag Everything With Function Versions
Use function versioning. Every deployment gets a version number. Your monitoring tags every invocation with that version. When errors spike after version 47, you roll back immediately. Without version tags, you stare at graphs wondering if the error started five minutes ago or five hours ago.
3. Build Three Tiers of Alerts
Set three tiers of alerts.
- Tier one: Page someone at 3 AM. Production down, data loss, payment failures;
- Tier two: Slack during business hours. High error rate, slow responses, throttling;
- Tier three: Weekly report. Cold start frequency, cost trends, log volume changes.
Most teams skip tier three. That is a mistake. Cold start trends predict user complaints before users complain.
4. Automate Canary Deployments
Automate canary deployments. Deploy your new function version to 5% of traffic. Monitor error rate and duration for fifteen minutes. Compared to the previous version. If metrics match or improve, roll to 100%. If not, abort. This is not nice to have. This is mandatory for serverless. Because a broken function deploys in seconds and breaks everything in seconds.
5. Write Runbooks Before Alerts
Write a runbook before you write the alert. For each alert, document three things:
- What does this metric mean?
- What are the first three troubleshooting steps?
- Who do you call?
If your runbook says “check logs,” you have failed. Be specific. “Check invocation ID 12345 in Log Explorer. Filter for ‘payment’ errors. Escalate to the payments team if more than three failures in five minutes.”
How to Choose a Serverless Monitoring Tool
The market is crowded. Datadog. New Relic. Dynatrace. Lumigo. Epsagon (now part of Cisco). AWS X Ray. Each tool makes promises. Here is how to cut through the noise.
Demand OpenTelemetry Support
Step one: demand OpenTelemetry support. OpenTelemetry is the open standard for traces, metrics, and logs. If a tool does not support it, walk away. You will switch tools someday. OpenTelemetry makes that switch possible. Without it, you are locked in. Vendor lock in for monitoring is like a timeshare. Expensive and hard to escape.
Test Cold Start Visibility With a Simple Experiment
Step two: test cold start visibility. Create a simple Lambda function. Let it idle for twenty minutes. Invoke it. Ask three questions:
- Does the tool show init duration separately from response duration?
- Does it label the invocation as a cold start?
- Can you filter invocations by cold start status?
Many tools fail this test. They show the total duration and call it a day. That is useless. You cannot fix what you cannot measure.
Check Sampling Controls Before Buying
Step three: check sampling controls. Can you:
- Sample 100% of errors?
- Sample 10% of successful requests?
- Change sampling rules without redeploying code?
The best tools offer dynamic sampling. They drop cheap traces and keep expensive ones. The worst tools sample randomly. Random sampling misses the one slow request that happens once per hour.
Calculate Real Cost Per Million Invocations
Step four: calculate cost per million invocations. Take the tool’s price. Then add:
- Your cloud provider’s egress fees;
- Storage costs for logs retained for thirty days;
- Query costs for dashboards and alerts.
Some tools look cheap at $0.10 per GB ingested. Then they charge $0.50 per GB for storage. Then your cloud charges $0.09 per GB for network egress. The real price is three times higher. Ask for a calculator. If they cannot provide one, assume the worst.
Test Search Latency Under Load
Step five: test the search latency. Ingest one million log lines. Search for a specific invocation ID. How many seconds? Five seconds is fine. Thirty seconds is not. Two minutes is a disaster. Your on-call engineer will not wait two minutes during an outage. They will scream. Then they will switch tools.
Verify Infrastructure as Code Integration
Final check: does it integrate with your infrastructure as code? You use Terraform or CloudFormation. Your monitoring tool should support the same workflow. Required capabilities:
- Create monitors via API;
- Version control your alerting rules;
- Review changes via pull requests.
Click to configure monitoring tools belonging in 2015. We are past that.
Run a Realistic Load Trial
One more thing. Free trials are deceptive. Most tools work great for ten thousand invocations per day. They break at one million. So run your trial at full expected load. Simulate traffic. Break things. See if the tool survives. If it collapses under load, you just saved yourself a year of frustration.
Serverless monitoring is not magic. It is discipline. You choose the right tool. You bake in observability. You accept that cold starts exist and measure them anyway. The cloud vendors will not fix this for you. They sell computers. You buy visibility. That trade off is the real cost of serverless. Now go monitor something.
