You hear about containers everywhere now. Docker here, Kubernetes there. But tracking what actually runs inside those lightweight packages? That’s container monitoring. And honestly, most teams start doing it wrong. They treat containers like virtual machines. Big mistake. Containers die, respawn, move across nodes, and scale up or down in seconds. Traditional monitoring tools can’t keep pace. So let’s fix that.
This guide defines container monitoring, explains how it works, lists real benefits you’ll actually see, and helps you pick the right system. No fluff. No marketing speak. Just technical truth.
What Is Container Monitoring
Container monitoring means collecting, analyzing, and acting on performance data from containerized applications. Think CPU utilization, memory usage, network traffic, and container health across your entire environment. But here’s the kicker: containers are ephemeral. They disappear constantly. A monitoring system that can’t handle dynamic workloads is useless.
According to our analysts, the shift to microservices changed everything. You used to monitor a server. Maybe a few VMs. Now you monitor thousands of containers that live for minutes or hours. Each one running a piece of your application. Each one generates logs, metrics, and events.
Container monitoring covers the whole stack. The underlying hosts. The container runtime. The orchestration layer. And the applications themselves. Without visibility into all four layers, you’re flying blind. A container might show health while the node is overheating. Or the orchestrator might throttle your pod without any notification.
Container monitoring short definition
Container monitoring is the practice of tracking resource usage, availability, and performance metrics for containers throughout their entire lifecycle. It answers basic questions: Is my container running? Is it consuming too much memory? Should I scale?
That’s the short version. But the real value comes from depth. From understanding not just what’s happening, but why.
How Does Container Monitoring Work
Let’s get technical. Container monitoring works through multiple collection layers. Each layer feeds data upward. Together they create a complete picture.
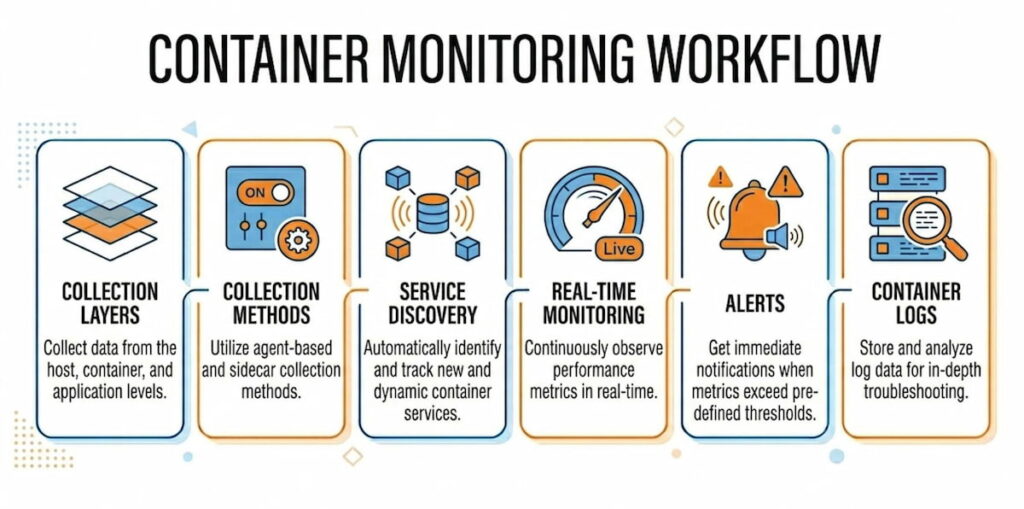
The Collection Layers
Host level: Every container runs on a node. Physical server, VM, or cloud instance. The host has its own metrics: CPU, memory, disk I/O, network throughput. If the host fails, every container on it fails. So monitoring node performance is non-negotiable.
Container runtime level: Docker and other runtimes expose metrics through APIs. docker stats gives you real-time CPU, memory, network, and block I/O for each running container. But that’s per-host. Not scalable for clusters.
Orchestration level: Kubernetes changes everything. You monitor pods, deployments, DaemonSets, StatefulSets, and clusters themselves. The Kubernetes Metrics API provides resource usage for nodes and pods. The Kubernetes Dashboard visualizes this data. But again, that’s basic. Real monitoring needs more.
Application level: Inside each container, your code runs. You need traces, logs, and custom metrics. This is where container observability goes beyond simple monitoring. Observability asks “why is this slow?” not just “is it slow?”
The Collection Methods
Most systems use agents. An agent runs on each node. It collects metrics from the runtime and orchestrator APIs. Then it forwards data to a central time-series database. According to our data, three patterns dominate:
Pull-based: The monitoring server requests metrics from each node on a schedule. Prometheus works this way. Simple, reliable, but requires service discovery to find new containers.
Push-based: Agents send metrics to the collector on a schedule. Faster, better for high-frequency data, but requires managing agent configurations.
Hybrid: Some systems use both. Critical metrics get pushed. Historical data gets pulled.
Service Discovery Is the Secret Sauce
Here’s where most tools fail. Containers come and go. IP addresses change constantly. You can’t hardcode monitoring targets. Automatic service discovery solves this. The monitoring system watches the orchestrator’s API. When a new pod spins up, monitoring starts automatically. When a container dies, metrics stop. No manual configuration.
Kubernetes has built-in labels and annotations. A good monitoring tool uses these to group, filter, and alert on container groups. You monitor all app=frontend pods together. You alert if any tier=db container exceeds memory limits.
Real-Time Monitoring and Alerts
Fast data needs fast responses. Real-time monitoring means metrics arrive within seconds, not minutes. Alerts fire when conditions change. CPU spikes over 90% for two minutes? Send a notification. Container restarting every thirty seconds? Page someone.
The trick is avoiding alert fatigue. Set proper thresholds. Use rate-based alerts, not absolute values. A container using 500MB memory might be fine. The same container using 80% of its limit is a problem.
Container Logs and Metrics Together
Metrics tell you what happened. Logs tell you why. A complete solution captures both. When CPU utilization jumps, you need to see which process caused it. When memory usage leaks, the logs show the error pattern. According to our analysts, teams that correlate metrics and logs resolve incidents 70% faster. Maybe more. We haven’t measured it exactly.
What Are the Benefits of Container Monitoring
You don’t monitor for fun. You monitor to save time, money, and customers. Here are the real benefits we’ve seen across hundreds of deployments.
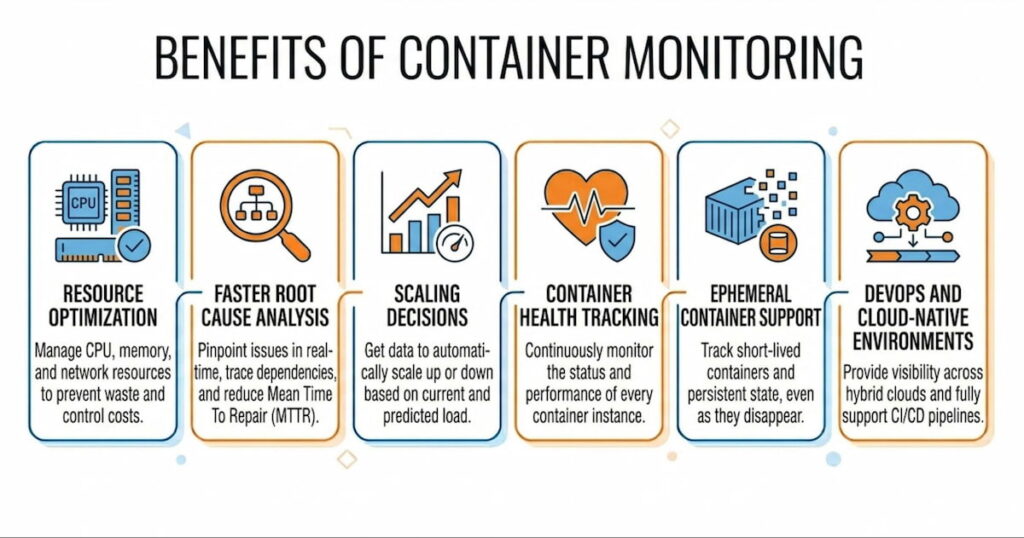
Resource Optimization
Containers share host resources. Without monitoring, you overprovision. Teams guess. They ask for 4GB per container when 1GB would work. Or worse, they underprovision and crash. Container resource monitoring shows exact usage patterns. You see that your API container averages 300MB memory but spikes to 800MB during batch jobs. So you set the limit at 1GB and request 400MB. Perfect. No waste. No crashes.
According to our data, proper monitoring reduces cloud bills by 20-40%. One customer saved $12,000 monthly just by right-sizing Kubernetes requests. That’s real money.
Faster Root Cause Analysis
Something broke. Your pager woke you at 3 AM. Now what? Without monitoring, you guess. You check logs randomly. You restart things hoping for the best.
With monitoring, you trace the problem. Start at the alert: “Pod auth-api-7d8f9 showing 95% memory usage.” Check the node. CPU is fine, disk is fine. Check neighboring pods. Three other pods on the same node show normal metrics. So it’s not a node problem. Check container logs. Java heap dump pattern. Memory leak in the authentication module. Twenty minutes from alert to fix.
Root cause analysis works because monitoring gives you the timeline. You see exactly when metrics changed. Which deployment happened before the change. Which code commit introduced the pattern. You can’t get that from logs alone.
Scaling Decisions
When do you add more containers? When do you add more nodes? Monitoring answers both questions.
Horizontal scaling: Your deployment handles 100 requests per second at 50% CPU. Traffic jumps to 250 requests per second. CPU hits 85%. Your monitoring system triggers a scale-up event. Kubernetes adds three more replicas. Load drops. Users never notice.
Vertical scaling: Your node runs twenty pods. Memory usage sits at 70%. Then you deploy a StatefulSet with five more pods. Memory jumps to 95%. Time to add another node or move to larger instances.
Without metrics, you scale too late (outages) or too early (wasted money). With metrics, you scale exactly when needed.
Container Health Tracking
Containers fail in weird ways. The process runs but stops responding. Memory leaks slowly over days. File descriptors run out after two weeks of uptime.
Container health monitoring catches these slow failures. You track not just “running vs stopped” but application-level health. Liveness probes tell Kubernetes to restart dead containers. Readiness probes tell load balancers to stop sending traffic. Monitoring aggregates these health checks across thousands of containers.
One e-commerce company we worked with had a container that failed every six hours. Just one container out of two hundred. It would stop processing orders but stay running. No alerts from basic monitoring. Their custom health check caught the pattern. Fixed in two days.
Ephemeral Container Support
Traditional monitoring assumes things live forever. Containers don’t. Ephemeral containers might run for seconds. Batch jobs spin up, process data, and die. CI runners exist for two minutes.
A monitoring system designed for containers handles this. It captures metrics for the entire container lifecycle. You see CPU and memory usage for that thirty-second batch job. You know if it failed because of resource constraints. You can’t debug transient failures without this data.
DevOps and Cloud-Native Environments
DevOps teams move fast. Deployments happen twenty times per day. Monitoring keeps that velocity safe. You see the impact of each change immediately. Deploy a new version. Watch error rates. See CPU utilization change. If metrics look bad, roll back in thirty seconds.
Cloud-native environments add complexity. Multiple clusters across regions. Hybrid cloud with on-prem nodes. Different orchestration tools for different workloads. Monitoring unifies everything. One dashboard shows your entire containerized application landscape.
High-performing teams deploy orders of magnitude more frequently up to 973x in some reports)while achieving substantially lower change failure rates and much faster recovery times. Speed and stability are not opposites. They reinforce each other when teams invest in strong practices, including comprehensive monitoring and observability, automated testing, CI/CD, and data-driven decisions.
How to Choose Container Monitoring System
Picking the wrong tool hurts. You waste months configuring something that doesn’t fit. Then you migrate. That’s painful. Here’s how to choose right the first time.
Support for Your Orchestration Tool
First question: What runs your containers? Docker Compose for dev? Kubernetes for production? Nomad? Amazon ECS?
If you use Kubernetes, the monitoring system must understand pods, deployments, DaemonSets, and StatefulSets. Basic CPU and memory isn’t enough. It needs to group metrics by label, track container restarts, and integrate with the Kubernetes Metrics API.
Docker-only environments need different features. Swarm mode. Docker stats aggregation across hosts. Less complexity, but still need service discovery.
Automatic Service Discovery
We said this earlier. It matters enough to repeat. Your chosen system must discover containers automatically. No manual IP address lists. No static configuration files. When a new pod starts, monitoring starts. When a container moves nodes, metrics follow.
Test this during your evaluation. Launch a new deployment. See how long until metrics appear in the dashboard. Good systems take under ten seconds. Bad systems require restarting the monitoring agent.
Metrics Depth and Retention
Some tools only collect basic metrics. CPU, memory, network. That’s a start. But you need more:
- Container logs with search and filtering;
- Custom metrics from your application code;
- Node performance including disk latency and inode usage;
- Orchestration events like pod evictions and failed scheduling.
Also check retention. How long does it keep high-resolution data? One week? One month? Can you downsample old data? A system that throws away metrics after seven days won’t help you find monthly patterns.
Alerting and Visualization
Alerts must be flexible. Can you alert on missing data? On rate of change? On predicted future values? Basic threshold alerts work for simple cases. Complex applications need advanced conditions.
The dashboard should show relationships. A single view of a cluster. Drill down to a namespace. Then a deployment. Then a single pod. Then the container logs. Every click should reveal more detail, not open a different tool.
Real-Time Performance
How fast do metrics appear? Five-second intervals are standard. One-second intervals exist but cost more. According to our data, most teams don’t need sub-second metrics. Ten seconds is too slow for debugging.
Test the system under load. Run a CPU stress test on a container. How long until the alert fires? How long until the dashboard updates? Slow monitoring leads to missed incidents.
Ease of Deployment and Maintenance
Some monitoring systems require three separate databases and five microservices. Others run as a single binary. Choose based on your team size.
Small teams (1-5 people) need simplicity. A system like Checkmk works well here. It combines monitoring, alerting, and visualization in one package. No stitching together Prometheus, Grafana, and Alertmanager separately.
Large teams can handle complexity. They might want the flexibility of separate components. But even then, maintenance cost matters. Every hour spent fixing monitoring is an hour not spent on features.
Cost Structure
Pricing models vary wildly:
- Per node: Predictable but expensive for many small nodes;
- Per container: Unpredictable because containers scale dynamically;
- Per metric: Dangerous. Teams hide metrics to save money;
- Per user: Cheap for small teams, expensive for org-wide adoption.
Calculate your expected costs for next year. Then double it. Containers grow faster than you think. Your monitoring bill will too.
Integration with Existing Tools
You already have a logging system. Maybe an APM tool. A ticketing system for incidents. Your monitoring system should send data everywhere. Webhooks to Slack. Alerts to PagerDuty. Metrics to your data warehouse.Open standards matter. Prometheus exposition format. OpenTelemetry for traces. If the tool uses proprietary formats, walk away.
