You need to know what’s happening right now. Not five minutes ago. Not after someone complains. Real-time monitoring gives you that immediate visibility. It continuously checks your systems, applications, and infrastructure, reporting status changes within milliseconds or seconds. This guide walks through everything: the mechanics, the benefits, the messier parts like schema evolution, and how AI changes the game. We’ll keep it practical. No fluff.
What is Real-Time Monitoring
Real-time monitoring is the automated process of collecting and analyzing telemetry data as it happens. Think system metrics, logs, traces, and events. The goal? Spot anomalies before they become outages. Traditional monitoring might check your server every five minutes. Real-time? Every second. Maybe faster.
How It Differs From Traditional Monitoring
| Aspect | Traditional Monitoring | Real-Time Monitoring |
|---|---|---|
| Check interval | 5-15 minutes | Sub second to 5 seconds |
| Alert delay | Minutes to hours | Seconds |
| Data retention | Weeks of aggregates | Days of raw, then aggregates |
| Use case | Capacity planning, trends | Incident detection, root cause |
| Typical cost | Lower storage, higher compute per query | Higher storage, lower compute per query |
This approach feeds into observability, which is broader. Observability asks “why is this broken?” using data you already have. Real-time monitoring asks “is something broken right now?” and fires alerts immediately. Both work together. But real-time monitoring is the fire alarm. Observability is the investigator showing up afterward.
Key Metrics You Should Track
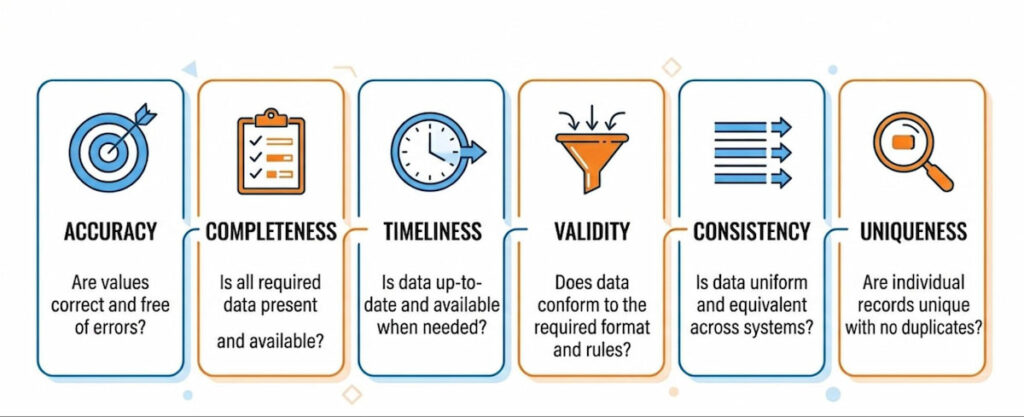
Key components include CPU usage, memory utilization, disk I/O, and network traffic. For applications, you track error rate, streaming latency, data volume, and data quality metrics like:
Yes, that’s a lot. But you don’t need all of them at once. Pick what matters.
Real-time monitoring isn’t magic. It’s fast math. And it’s becoming mandatory. Why? Because users expect zero downtime. One slow checkout page costs sales. One corrupted data pipeline breaks reports for hours. Real-time monitoring catches these things early.
How Real-Time Monitoring Works
First, you deploy agents or collectors on your systems. These pull eBPF metrics from the kernel. eBPF is a modern Linux superpower. It lets you run sandboxed programs inside the operating system without changing code. You get deep visibility into CPU usage, memory utilization, Disk I/O, and Network traffic with almost zero overhead.
Common collection methods:
- Agents (Telegraf, Vector, Fluent Bit);
- eBPF probes (auto instrumenting kernels);
- OpenTelemetry collectors (vendor neutral);
- API integrations (cloud provider metrics).
Streaming and Processing
Second, you stream that data to a processing layer. This could be a time series database like Prometheus , a log aggregator like Loki, or a full observability platform. The data moves as telemetry data events. Each event has a timestamp, a value, and metadata tags (server name, environment, service ID).
Anomaly Detection
Third, the system applies rules. Static thresholds: “Alert if CPU > 85% for two minutes.” Dynamic baselines: “This server usually uses 40% memory at 2 PM. Now it’s at 78%. That’s weird.” Machine learning models can detect anomalies that static rules miss. For example, a gradual memory leak looks normal against a fixed threshold but stands out to a trend detector.
Alerting and Incident Management
Fourth, when a rule triggers, you get an alert. That alert goes to incident management tools like PagerDuty , Opsgenie, or Slack. The goal is MTTD (mean time to detect) and MTTR (mean time to resolve) . Real-time monitoring shrinks both. Sometimes from hours to seconds.
A Concrete Pipeline Example
A concrete example: pipeline metrics in a Kafka stream. You monitor streaming latency (how long a message takes from producer to consumer). If latency jumps from 200ms to 5 seconds, an alert fires. Your team checks data lineage (where the message came from and which transformations it passed through). Maybe a schema change broke a parser. Schema evolution without backward compatibility is a common culprit. Real-time monitoring doesn’t fix it, but it tells you exactly when things went wrong.
Benefits of Real-Time Monitoring
The advantages stack up fast. Let’s list them plainly.
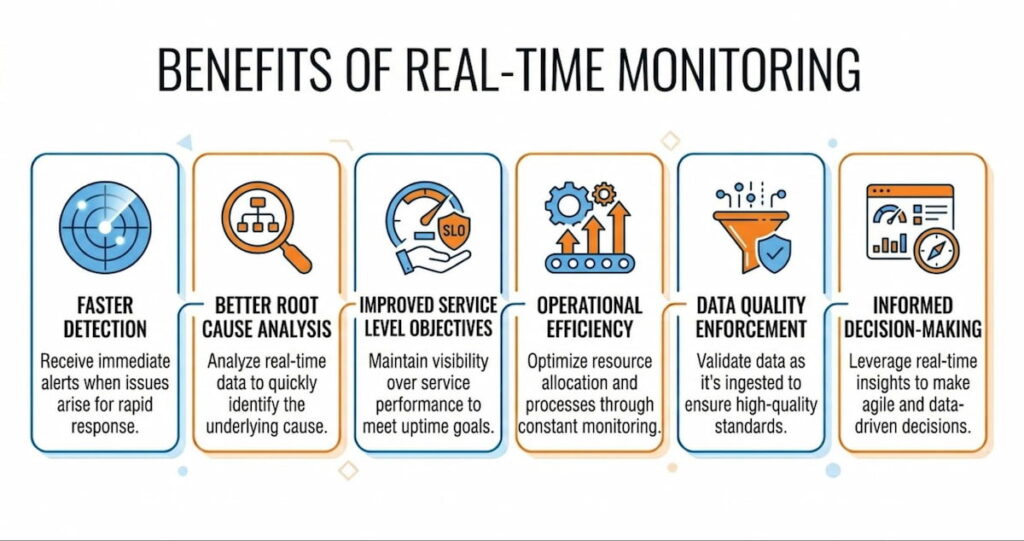
Faster Detection
Faster detection equals less damage. A corrupted database replicating for six hours is a nightmare. Catch it in six seconds? You roll back one transaction. Downtime costs average $5,600 per minute according to some estimates. Real-time monitoring cuts that risk.
Better Root Cause Analysis
Better root cause analysis. When you have second by second system metrics before a crash, you can trace backwards. Root cause analysis becomes straightforward:
- “Memory spiked at 10:03:22”
- “Garbage collection paused at 10:03:25”
- “Service died at 10:03:27”
Without real-time data, you’re guessing.
Improved Service Level Objectives
Improved service level objectives (SLOs) . You can measure actual performance against your targets every minute. If you promise 99.9% availability, real-time monitoring validates that. It also shows error budgets burning in real time. Teams can stop deploying risky changes when the error budget gets low.
Operational Efficiency
Operational efficiency. On call engineers spend less time triaging. Alerts are precise and immediate. No more “is this still happening?” conversations. The dashboard shows green or red. Right now.
Data Quality Enforcement
Data quality enforcement. For data pipelines, data quality metrics like completeness (did we get all expected records?) and validity (are dates in correct format?) can be checked on every batch. If accuracy drops below 98%, stop the pipeline. Fix it. Resume. This prevents bad data poisoning your analytics.
We think the biggest win is psychological. Teams stop dreading Monday mornings. They know problems surface within seconds, not after a customer complains.
Real-Time Monitoring Use Cases
Different industries, different needs. Here’s where real-time monitoring shines.
DevOps and Infrastructure
Track CPU usage, memory utilization, Disk I/O, and Network traffic across hundreds of servers. Auto scaling decisions use this data. When load passes a threshold, spin up new instances. When it drops, terminate them.
Application Performance Monitoring (APM)
Tools like Datadog, New Relic, and Cisco AppDynamics ingest telemetry data from your code. They report error rate, request latency, and database query performance. You see exactly which line of code is slow.
Data Pipeline Observability
Modern data stacks use Kafka, Airflow, dbt, and Snowflake. Pipeline metrics include data volume (rows per second), streaming latency, and data quality metrics. If consistency fails between two tables, an alert fires. Edge Delta is one platform that processes this data at the edge. It analyzes before sending, reducing bandwidth costs.
Security Monitoring
Detect brute force logins or unusual API calls. Real-time monitoring looks for anomalies like a user downloading 10,000 records at 3 AM. Integrate with Splunk for correlation across logs and network traffic.
IoT and Manufacturing
Sensors on assembly lines report temperature, vibration, and speed. If a bearing runs hot for three seconds, the system slows that machine. Prevents catastrophic failure.
Financial Trading
Milliseconds matter. Real-time monitoring checks order latency, market data feeds, and risk limits. A position exceeding its limit triggers automatic hedging.
Platform Comparison Table
| Tool | Primary Focus | Key Strength |
|---|---|---|
| Datadog | Infrastructure + APM | Unified metrics, logs, traces |
| New Relic | APM + observability | Strong developer experience |
| Splunk | Log analysis + security | Massive data ingestion |
| Cisco AppDynamics | Business transaction monitoring | Application dependency mapping |
| Edge Delta | Edge processing | Reduces data volume, saves cost |
| TrueSight Capacity Optimization | Capacity planning | Predictive analytics |
Challenges and Solutions in Real-Time Monitoring
Nothing’s perfect. Real-time monitoring introduces its own headaches. Here’s each problem and a practical fix.
Data Volume Explosion
Challenge: Collecting everything every second generates terabytes. Storage costs explode.
Solution: Sampling, aggregation, and edge processing. Edge Delta filters metrics at the source. Send only anomalies or statistical summaries. Keep raw data for only 7 days. Older data moves to cold storage.
Alert Fatigue
Challenge: Too many alerts and your team goes numb. They’ll ignore the fifth “CPU spike” warning. Then a real outage happens.
Solution: Dynamic thresholds and alert grouping. Don’t fire for every 5 second spike. Wait for sustained deviations. Use SLOs to prioritize. An alert that breaches an SLO is high urgency. A minor CPU blip? Maybe just a dashboard annotation.
Latency Versus Cost Trade Off
Challenge: True real time (sub second) is expensive. Do you need it? Maybe not.
Solution: Define “real time” for each use case. Payment fraud detection needs milliseconds. Batch ETL monitoring can tolerate 60 seconds. Match your investment to the requirement.
Schema Evolution Problems
Challenge: Your logs and metrics change format. A team adds a new field. Another renames an old one. Without careful handling, monitoring breaks.
Solution: Adopt a schema registry (like Confluent’s) that tracks versions. Your monitoring pipeline should tolerate unknown fields. Or validate against a known schema and flag validity failures.
Data Lineage Confusion
Challenge: You see an anomaly. But which upstream system caused it?
Solution: Data lineage maps dependencies. “Table X gets data from Kafka topic Y, which gets data from service Z.” Real-time monitoring tools can overlay anomalies on this lineage graph. Then you see the root cause instantly.
Tool Sprawl
Challenge: Teams buy Datadog for metrics, Splunk for logs, and something else for traces. Engineers jump between dashboards. Observability suffers.
Solution: Choose one primary platform. Export data from others into it. Or use open standards like OpenTelemetry . That decouples instrumentation from the backend.
Best Practices for Effective Implementation
Don’t just install agents and hope. Follow these rules.
1. Prioritize Critical Paths
What breaks that loses money or customers? Monitor that first. Your checkout flow. Your authentication service. Your main database. Leave the internal admin panel for later.
2. Define Clear SLOs
For each service, pick one or two key metrics. Example: “Search latency p99 < 300ms over any 5 minute window.” Then define an error budget. Real-time monitoring tracks these continuously. When you violate the SLO, that’s a real alert. Everything else is a lower priority.
3. Build Role Specific Dashboards
Build dashboards for roles, not for everything. An SRE needs different views than a data engineer:
- SRE dashboard: CPU usage, memory utilization, error rates, network traffic;
- Data engineer dashboard: pipeline metrics, streaming latency, data quality metrics (completeness, uniqueness);
- Security dashboard: Failed logins, unusual API patterns, anomalies in access logs.
Separate dashboards reduce noise.
4. Tag Everything
Every metric should have metadata: environment (prod/staging), service name, region, pod ID, version. When you see an anomaly, you can filter. “Is this happening only in us-east-1? Only on version 2.3.1?” Without tags, you’re blind.
5. Test Your Alerts Regularly
Simulate failures. Does the alert fire? Does it reach the right person? Does it include enough context? Many teams skip this. Then a real outage happens and the alert says “metric X high” with no link to a runbook. That’s useless.
6. Implement an Anomaly Detection System
Start with static thresholds. Then introduce machine learning for anomaly detection on one metric. Compare results. If the ML model generates false positives, tune it or discard it. Don’t trust black boxes.
7. Monitor the Monitoring Itself
Your monitoring system can fail. The disk fills up. License expires. Network partition blocks alerts. Set up a heartbeat. If no metrics arrive for 5 minutes, send an out of band alert via a different channel.
How to use AI for Real-Time Monitoring
AI transforms real-time monitoring from rule-based to intelligent. Models learn normal patterns across CPU usage, memory utilization, network traffic, and error rate. They flag anomalies that static thresholds would miss.
Anomaly Detection and Root Cause Analysis
Anomaly detection runs continuously. Unusual spikes in data volume or streaming latency trigger investigation even if values stay inside old limits. False positives drop because AI understands context.
Root cause analysis speeds up dramatically. AI correlates logs, traces, metrics, and pipeline events. It suggests likely sources instead of forcing manual hunting.
Predictive capabilities emerge. Models forecast potential breaches of SLOs based on trends. Teams address issues before they affect users.
AI Agent Solutions in Action
AI agent solutions take action in some setups. Edge Delta offers AI teammates that analyze real-time telemetry, surface insights, and propose fixes. They collaborate with human operators through chat interfaces.
eBPF metrics feed AI with low-overhead kernel data. Visibility into AI agents themselves becomes possible. Behavior monitoring catches risky actions or resource waste in real time.
Reducing Alert Noise
Alert noise reduction stands out as a practical win. AI filters and prioritizes so only high-confidence issues reach on-call staff. MTTD and MTTR improve as a result.
Data quality monitoring benefits too. AI spots drift in accuracy, completeness, or consistency across streams. Schema evolution gets flagged with explanations.
Integration with existing tools works smoothly. Datadog, New Relic, Splunk, and Cisco AppDynamics increasingly embed AI features. TrueSight adds capacity optimization intelligence.
Challenges remain. Models need quality training data. Explainability matters for trust. Human oversight stays essential for critical decisions.
AI Augments
We think AI augments rather than replaces skilled teams. It handles volume and pattern recognition. People bring context and judgment. Combined, they deliver faster, smarter real-time monitoring.
Start with anomaly detection on key metrics. Measure impact on incident volume and resolution time. Expand to predictive and agentic features once value proves clear.
Real-time monitoring continues to mature. Telemetry pipelines grow more efficient. Observability deepens. AI adds smarts. Organizations that implement it thoughtfully see lower downtime, faster recovery, and calmer operations.
Pick pain points first. Instrument critical paths. Monitor data quality alongside performance. Build response processes. Layer AI where it accelerates insight. Results appear in smoother running systems and more predictable performance.
