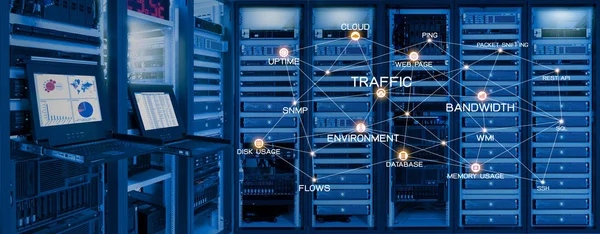
Network monitoring tools are an essential element of modern business processes. They collect data from your devices and connections, so you can spot issues and keep your systems running.
Strong network visibility helps you find any slowdowns, outages, and other problems before they disrupt users. So, you should choose quality tools with all the necessary characteristics and integrations.
The best choice depends on your network size and technical needs. Keep reading and learn about some popular solutions!
About Network Monitoring Tools
Network monitoring tools track the health and performance of your systems. They collect information from your devices and connections to turn it into practical insights.
As Peter Drucker famously said,
“You can’t manage what you can’t measure.”
Monitoring tools match this idea by giving you details about what is happening with your networks.
These instruments can scan several important areas, including
- Network performance;
- Bandwidth use;
- Load testing;
- Availability;
- Latency and packet loss;
- Appliances and connections;
- Network traffic.
Scanning this data helps your IT teams notice any problems earlier. So, they can research the reason and fix the issue before it leads to serious disruptions.
Top 6 Network Monitoring Tools
Network monitoring tools help you track all your appliances and overall performance. However, different instruments suit different environments. So, you need to find an option that will match your needs.
Below, we have gathered the top 6 tools you can try.
| Tool | Best For | Features |
|---|---|---|
| Datadog | Businesses that require end-to-end observability | Device tracking, traffic control, network connectivity maps, custom dashboards, automated alerts |
| IBM | Large organizations with complex settings | Asset tracking, analytics dashboards, event monitoring, enterprise integrations |
| Zabbix | Teams that want individualized open-source monitoring | Performance indicators, automated device discovery, custom dashboards, data visualization, API integrations |
| SolarWinds NPM | IT teams overseeing infrastructure performance | Device control, network discovery, topology mapping, bandwidth tracking |
| Dynatrace | Businesses with cloud-based applications | Infrastructure monitoring, cloud monitoring, AI-powered analysis, dependency analysis |
| Paessler PRTG | Businesses that want a sensor-based strategy | Bandwidth monitoring, network mapping, automatic device discovery, custom dashboards, performance reports |
Datadog
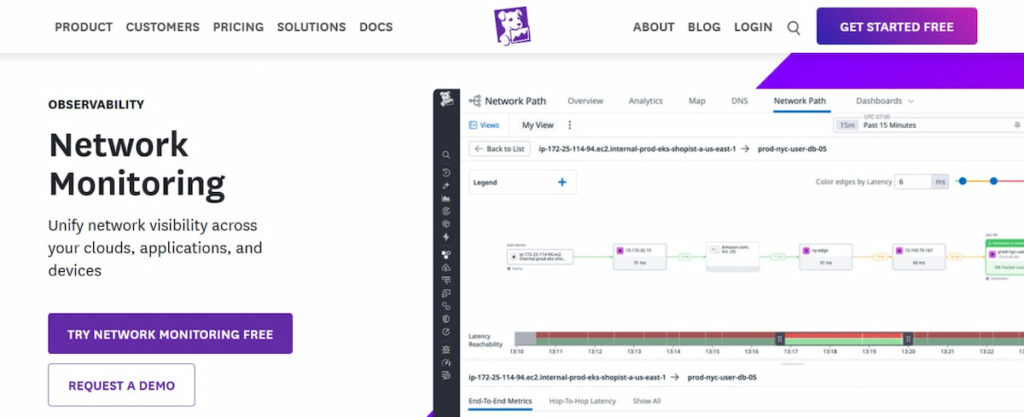
Datadog is a cloud observability platform that offers tools for assessing a broad range of networks and apps.
It can give you a central view of your performance. So, you will understand how different issues impact your online environment.
You can integrate Datadog with routers, cloud services, and other tools. This platform gathers performance data and displays it in dashboards and visual reports.
Some of its key features include
- Device monitoring;
- Performance checks;
- Network connectivity maps;
- Custom panels;
- Automated warnings;
- Application monitoring;
- Integrations with third-party apps.
You can use this tool to control network health in real time and investigate unusual performance shifts. For example, you might check bandwidth use on different devices and get a warning during a traffic increase.
Datadog is a good option for businesses that need network monitoring as a component of a broader observability platform.
IBM
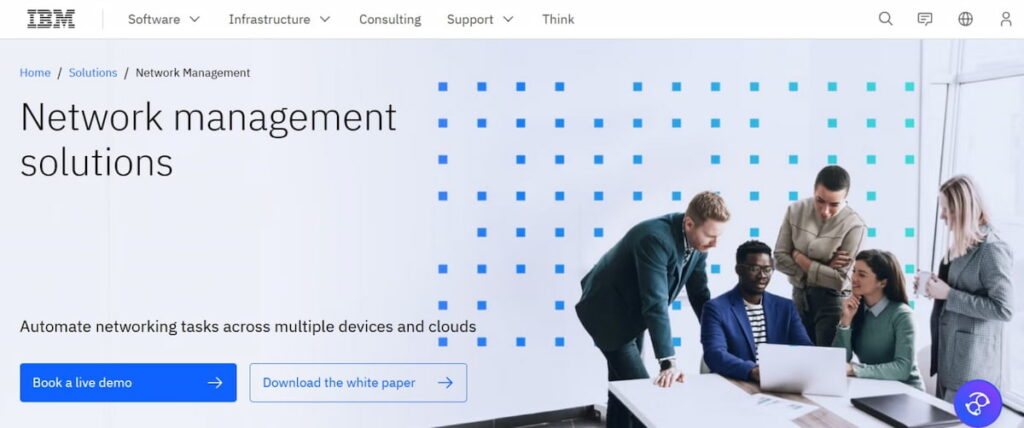
IBM delivers network monitoring and observability capabilities through its broader IT operations portfolio. Its offerings can help you control complex domains and understand how different infrastructure segments affect implementation.
IBM pulls data from various systems into a single, centralized environment. It allows you to analyze any incidents in large infrastructures.
The primary features of this platform are
- Performance scans;
- Infrastructure tracking;
- Performance dashboards;
- Activity tracking;
- Automatic alerts;
- Infrastructure details analysis;
- Compatibility with enterprise environments.
You can use IBM’s solutions to assess infrastructure health and resolve performance problems. You can set up rules and alerts for important devices and services.
This platform also lets you investigate problems that involve numerous systems. Instead of looking at the subject separately, you can explore related application events. It will help you get a broader view of the situation.
IBM is a strong choice for larger organizations managing complex environments.
Zabbix
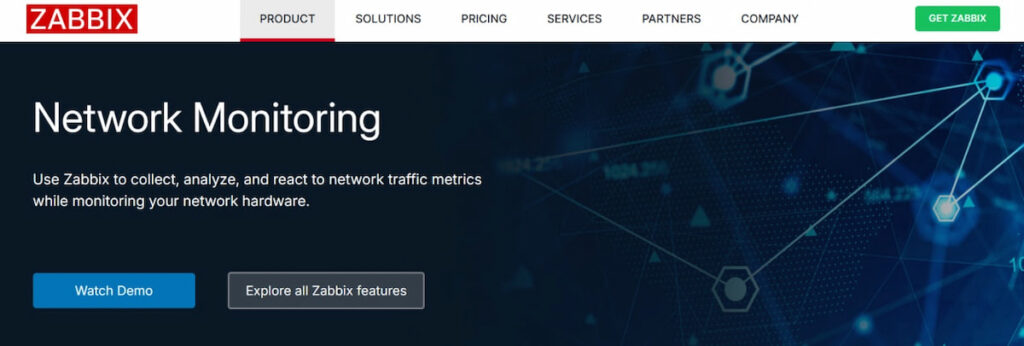
Zabbix provides open-source tools for managing your servers and network environments. It gives you a lot of flexibility to customize the platform.
It can run on your existing infrastructure and adapt to your specific requirements. It works with standard monitoring protocols and supports various network tools.
Some of its key features are
- SNMP tracking;
- Network performance metrics;
- Custom dashboards;
- Alerting and notifications;
- Visual analytics;
- Monitoring templates;
- API integrations;
- Historical performance data.
You can use this tool to set specific limitations for individual devices or their classes. You can also create alerts for certain conditions.
However, Zabbix might demand more specialized knowledge than some commercial platforms. Your team must manage deployment and configuration tasks. Plus, you’re responsible for handling upgrades, which can add complexity to platform management.
SolarWinds
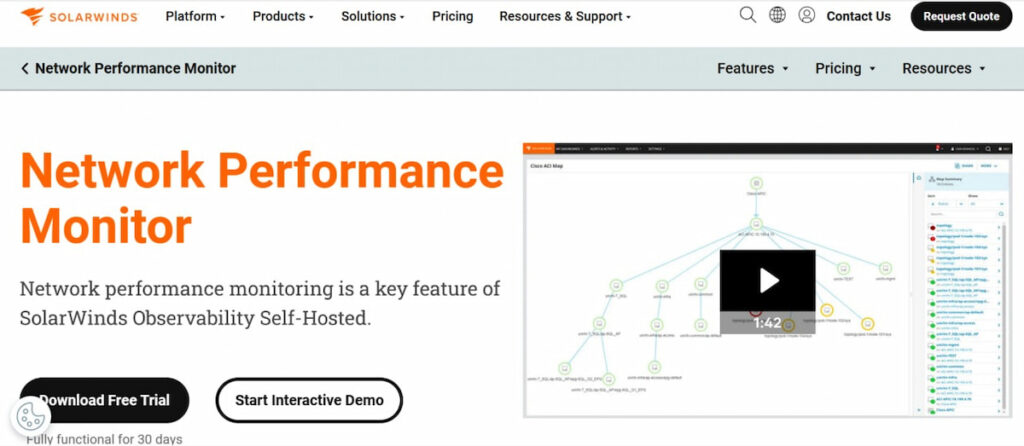
SolarWinds is a monitoring solution that helps organizations track the performance of their digital infrastructure.
The main features of SolarWinds NPM are
- Device and performance monitoring;
- Automatic network detection;
- SNMP control;
- Bandwidth checks;
- Performance dashboards;
- Alerts and notifications;
- Traffic analysis.
This platform can show you how any of your devices work over time. So, you can easily determine their performance changes.
You can use its alerting features to get notifications when your device becomes unavailable or a server metric crosses a set threshold.
You can also analyze documented data to find systematic problems. This information highlights possible blockages and helps you plan changes.
SolarWinds NPM is a top choice for IT teams that want strong discovery and reporting capabilities.
Dynatrace

Dynatrace is an observability platform that combines network monitoring with application and cloud tracking. It shows how your web activity impacts the rest of your IT environment.
This platform pulls data from your infrastructure and integrates it with data from applications and other systems. So, you uncover more insights when looking into implementation issues.
Some of its essential features are
- Performance examination;
- Application performance tracking;
- Cloud monitoring;
- Real-time issue detection;
- Dashboards;
- Distributed tracing;
- Dependency analysis.
You can employ Dynatrace to investigate issues that affect several parts of your environment. For example, you can examine online performance and infrastructure metrics jointly if your application becomes slow.
This platform can also help you understand how services and systems are connected. So, it becomes much easier to pinpoint the source of the issue and determine affected users.
Dynatrace works well for businesses with cloud environments and distributed applications.
Paessler PRTG
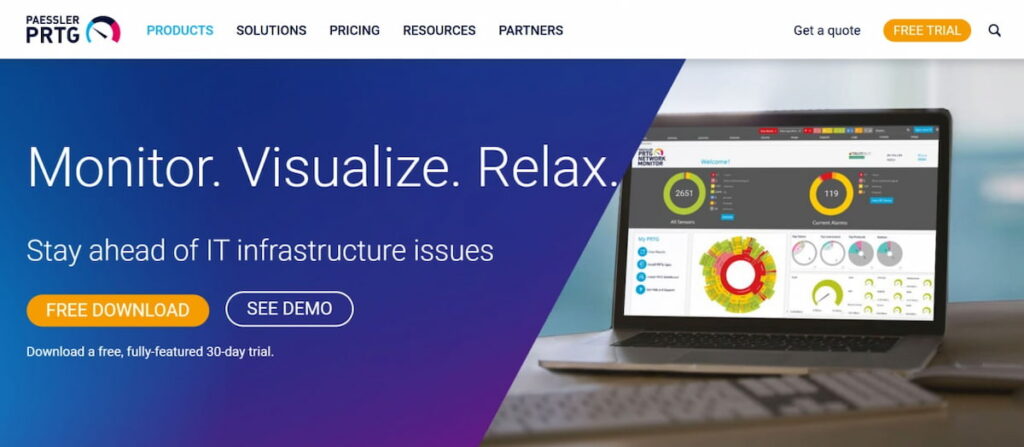
PRTG from Paessler is a network monitoring platform that helps you track devices and system performance. It uses sensors to scan specific metrics across your network.
Its main characteristics include
- Bandwidth monitoring;
- SNMP checks;
- Traffic analysis;
- Asset mapping;
- Automatic device discovery;
- Custom dashboards;
- Performance reports;
- Sensor-based monitoring.
You can set up sensors to scan CPU usage, uptime, and response times. Each sensor will work on a specific part of your infrastructure.
PRTG will also alert you if the values you picked reach a particular point. Plus, you can access past data and trends through this platform. It helps you spot recurring problems and prepare for upcoming upgrades.
PRTG can be a good fit for businesses that want more control without creating a monitoring system from scratch.
Benefits of Using Network Monitoring Tools
Your network plays a key role in keeping your workflows running smoothly. So, quality monitoring tools are essential to help you prevent any problems. They make it much easier for you to react when something goes wrong.
Reduced Downtime
Network problems can stop your employees from accessing applications, sites, and other services. Monitoring tools can detect these failures and various performance issues early.
You can set alerts for any events that are important. So, your team will have the time to respond and prevent a major outage.
Visibility Improvements
Modern networks can include
- Physical devices;
- Cloud services;
- Remote users;
- AI applications;
- Connected structures.
You might struggle to evaluate how these components function together without the right tools. Professional software gives you a central view of their health. You can see which devices are dynamic and where problems may exist.
Less Manual Troubleshooting
Your IT teams may need to check devices and systems manually without automated monitoring. It usually requires a lot of time, especially if you have large or distributed networks.
Monitoring tools can automate most of these data collection and alerting processes. So, you can investigate important issues instead of constantly checking on individual devices. AI agents can collect the initial details of network-related service requests and route them into a consistent response process, leaving engineers more time for diagnosis.
Typical Mistakes to Avoid
Finding a suitable monitoring tool is only your first step. You need to configure and use it properly to actually get some value from it.
Some of the typical mistakes you should avoid include
- Monitoring too many metrics;
- Setting up too many notifications;
- Ignoring past details;
- Non-scalable platforms:
- Cost-only approach;
- Skipping integration testing.
Avoiding these mistakes will ensure your monitoring arrangement is more valuable. You can reduce excessive warnings and concentrate on useful data. It’s important that you pick a platform that continues to support your team as your network grows.
Conclusion
Top network monitoring tools for your business depend on your monitoring needs and the way your IT environment is structured. It’s important to consider several factors when evaluating these tools, including
- Network size;
- Technical expertise;
- Required features;
- Integrations;
- Scalability;
- Budget.
A small business doesn’t need the same advanced capabilities as a large enterprise. So, the best network monitoring tool is the one that gives your team useful visibility and helps you respond to problems quickly.