Website performance monitoring tracks how fast and reliably a website loads and responds to user actions. A one-second delay in page load speed increases bounce rate by 32%. For e-commerce sites, improving page load time from 3 seconds to 1 second lifts conversion rate by 20–30%. According to HTTP Archive data from February 2026, only 53% of origins pass all three Core Web Vitals thresholds . This guide explains the two monitoring approaches, key metrics, best practices, strategies, and tool selection.
What Is Web Performance Monitoring?
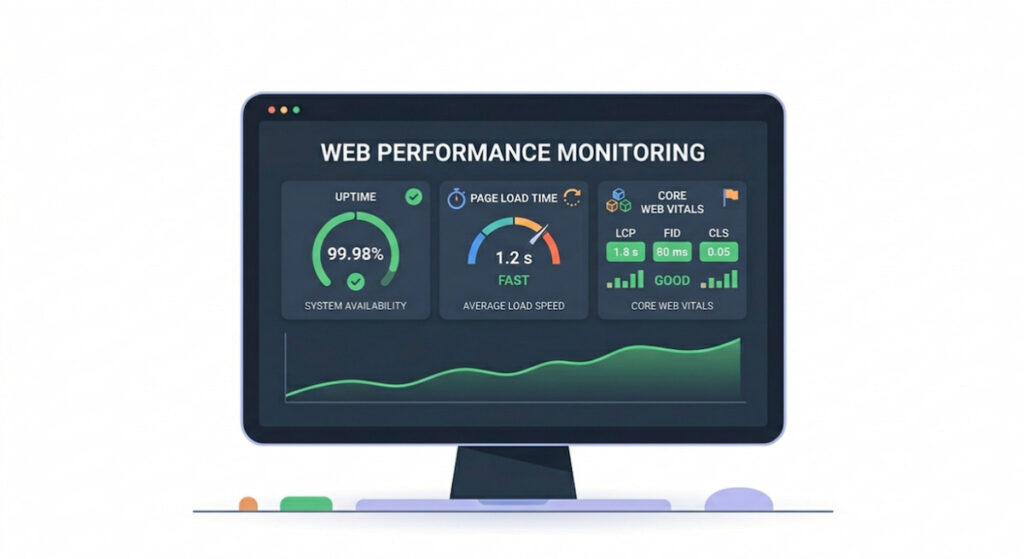
Website performance monitoring measures three things: availability (uptime), speed (page load time), and interaction quality (Core Web Vitals). The practice uses automated tests and real visitor data to find bottlenecks.
Monitoring prevents revenue loss. Downtime costs for a typical e-commerce site reach $10,000 per hour. Slow page load speed directly reduces SEO (Search Engine Optimization) rankings. Google confirmed Core Web Vitals as ranking factors in 2021.
Without website performance monitoring, teams cannot prove whether a code change improved or degraded user experience (UX) . Monitoring provides objective data for optimization decisions.
Two Sides of Web Performance Monitoring
Real-user monitoring (RUM) collects performance data from actual visitors across real devices, browsers, and network conditions. Real-user monitoring (RUM) shows exactly what real humans experience but cannot detect problems before users encounter them. According to our analysts, RUM helps identify performance bottlenecks in real time across different geographies and device types.
Synthetic monitoring runs automated tests from controlled locations at fixed intervals. Monitor.us provides synthetic checks starting at $10 per month for 10 test locations. Synthetic monitoring catches outages before any real user sees downtime. Synthetic monitoring works even with zero traffic and is ideal for pre-production staging checks.
Both monitoring types serve different purposes. Real-user monitoring (RUM) reveals actual visitor frustration patterns. Synthetic monitoring offers consistent baselines and immediate outage alerts. The best practice combines both: synthetics for proactive reliability and RUM for field truth and business impact correlation.
Key Metrics in Web Performance Monitoring
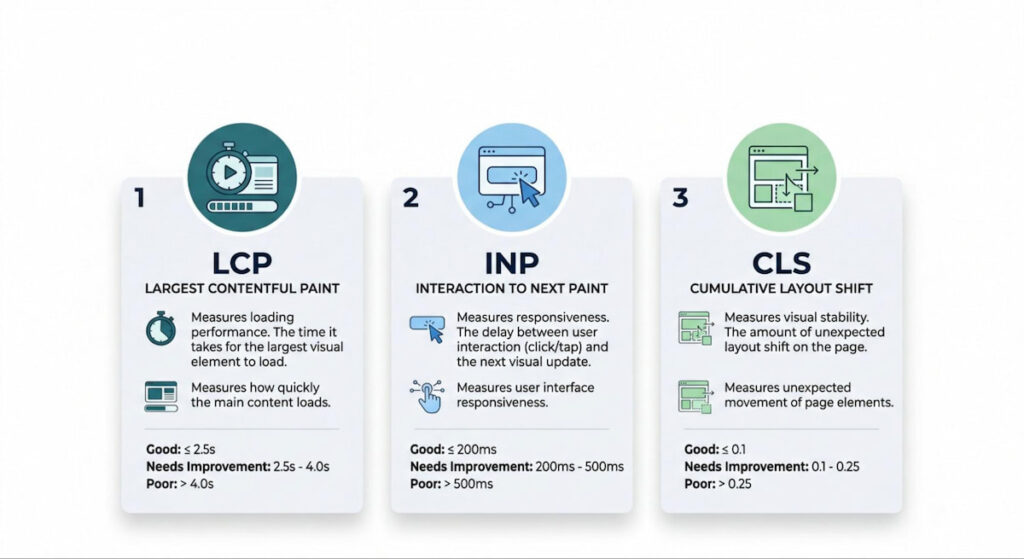
- Largest Contentful Paint (LCP) measures loading speed. Largest Contentful Paint (LCP) records when the main page content renders. Google requires LCP below 2.5 seconds for good performance. A slow LCP makes users feel the page takes too long to load, leading to frustration and higher bounce rates;
- Interaction to Next Paint (INP) measures responsiveness. Interaction to Next Paint (INP) tracks delay between a user click or tap and the browser’s visual response. INP replaced First Input Delay (FID) as the Core Web Vitals responsiveness metric . An INP under 200 milliseconds feels instant. An INP above 500 milliseconds drives visitor frustration and abandonment. According to the Galaxus design system, good INP requires under 100ms, while acceptable performance stays under 200ms;
- Cumulative Layout Shift (CLS) measures visual stability. Cumulative Layout Shift (CLS) scores unexpected movement of buttons, images, or text. A CLS score below 0.1 prevents users from accidentally clicking the wrong element. Common CLS causes include images without dimensions, dynamically injected ads, and late-loading web fonts.
Speed index shows how quickly page content visually populates above the fold. Lower speed index values mean faster perceived user experience (UX).
Error rate tracks failed HTTP requests, JavaScript errors, and server failures. Error rate above 1-3% damages user retention and customer engagement.
Session duration correlates directly with page load speed. Pages loading under 2 seconds achieve 2x longer session duration compared to 4-second loads.
ROAS (Return on Ad Spend) improves with faster performance. A 0.5-second reduction in page load time increases ROAS by 15–20% for paid search campaigns.
Web Performance Monitoring Best Practices
Set Uptime Alerts on Every Critical Page
Uptime below 99.9% costs medium businesses $10,000 monthly in lost revenue. Uptime alerts from Pingdom or Monitor.us trigger within 1 minute of failure detection. Every e-commerce checkout page needs a separate uptime check. Real browser monitoring captures actual rendering behavior including complex JavaScript execution and layout shifts.
Measure Page Load Speed Separately for Desktop and Mobile
Mobile responsiveness failures cause 60% of high bounce rate on smartphones. Page load speed on 3G networks often exceeds 5 seconds even when desktop loads in 2 seconds. Google Analytics reports mobile vs desktop page load time in the Site Speed section. Using real browsers (Chrome, Firefox, Edge) instead of headless scripts provides accurate measurements of Core Web Vitals.
Reduce HTTP Requests to Under 50 Per Page
Each HTTP request adds 50–200 milliseconds to page load time. A page with 100 HTTP requests loads at least 2 seconds slower than a page with 40 requests. Combine CSS files into one file. Combine JavaScript files into one file. Use CSS sprites for multiple small images.
Implement Browser Caching for Static Assets
Browser caching eliminates repeat downloads of CSS, JavaScript, fonts, and images. Set cache-control headers to one year for assets that rarely change. Browser caching reduces page load time for returning visitors by 50–80%.
Activate Minification for All CSS, HTML, and JavaScript
Minification removes spaces, comments, and unused code from text files. Minification shrinks file sizes by 30–60% without changing functionality. GTMetrix shows exactly how much weight minification would remove from each file.
Use Image Optimization Tools Before Uploading
TinyPNG compresses PNG and JPEG files by 50–80% without visible quality loss. A 1MB hero image compressed to 200KB cuts Largest Contentful Paint (LCP) by 400–600 milliseconds. Image optimization should never wait for deployment, apply TinyPNG to every image before it touches the server. Control total homepage image size under 2MB for optimal performance.
Install a Content Delivery Network (CDN)
Content Delivery Network (CDN) distributes assets to servers within 100 miles of every user. CDN cuts load times by 50–150 milliseconds for global audiences. Cloudflare offers a free CDN tier. Akamai provides enterprise CDN with 99.999% uptime guarantees. Geographic distributed monitoring helps verify CDN routing effectiveness across different regions.
Monitor SSL Certificates and Set Auto-Renewal
Expired SSL certificates make the site completely inaccessible in modern browsers. Security monitoring for SSL certificates prevents catastrophic downtime. Monitor.us includes SSL certificate expiry alerts in its $10 per month plan.
Web Performance Monitoring Strategies
- Start diagnosis with PageSpeed Insights. PageSpeed Insights runs Lighthouse on any URL and returns specific fixes with priority scores from 0–100. PageSpeed Insights combines simulated lab data with real user data from the Chrome User Experience Report;
- Run synthetic monitoring every five minutes from three geographic regions. Pingdom offers 5-minute synthetic checks starting at $10 per month per location. Synthetic monitoring should script critical journeys including login, search, add-to-cart, and checkout flows;
- Deploy RUM through Google Analytics. Google Analytics reports LCP , INP , and CLS in the Site Speed report for free;
- Test with GTMetrix weekly for waterfall analysis and shows each asset’s load sequence and identifies the single slowest HTTP request. GTMetrix waterfall diagrams reveal DNS lookup time, SSL negotiation, server response time, and third-party content delays;
- Run Lighthouse inside Chrome DevTools after every deployment. Lighthouse generates performance scores and lists failing audits with estimated savings in milliseconds.
How to Choose the Web Performance Monitor
| Tool | Best Use Case | Price | Key Feature | Limitation |
|---|---|---|---|---|
| Pingdom | Uptime + quick checks | $10/month per check | User-friendly dashboard | Limited waterfall detail |
| GTMetrix | Waterfall + Speed index | Free; Pro $15/month | Detailed request timing | No built-in uptime |
| PageSpeed Insights | SEO + Core Web Vitals | Free | Google’s own scoring | No continuous monitoring |
| Google Analytics | RUM by segment | Free | Correlates with conversions | No synthetic testing |
| Monitor.us | Combined synthetic + RUM | $10/month for 10 checks | SSL expiry alerts | Smaller ecosystem |
| Lighthouse | Local debugging | Free (Chrome DevTools) | CI/CD integratable | Manual, not automated |
Selection criteria: First, verify the tool measures Interaction to Next Paint (INP) and Cumulative Layout Shift (CLS) , not just Largest Contentful Paint (LCP) . Second, require both synthetic monitoring and real-user monitoring (RUM) capabilities for complete coverage. Third, confirm integration with Google Analytics to correlate performance with conversion rate. Fourth, check the maximum test frequency (5 minutes or better). Fifth, ensure mobile device testing under 3G network profiles.
For small sites under 10,000 monthly visits, start with PageSpeed Insights and GTMetrix free tiers. Add Pingdom for uptime alerts when monthly revenue exceeds $5,000. For enterprise, combine Monitor.us for synthetic with Google Analytics for real-user monitoring (RUM).
Key Takeaways
- Website performance monitoring requires both real-user monitoring (RUM) and synthetic monitoring for complete visibility;
- Core Web Vitals (Largest Contentful Paint (LCP) , Interaction to Next Paint (INP) , Cumulative Layout Shift (CLS) ) directly affect SEO (Search Engine Optimization) rankings and bounce rate;
- A 1-second faster page load speed increases conversion rate by 10% and customer engagement by 15%;
- Downtime costs exceed $10,000 per hour for e-commerce. Monitor uptime every 5 minutes with Pingdom or Monitor.us;
- Start with PageSpeed Insights , add GTMetrix for waterfall analysis, then deploy Google Analytics for real-user monitoring (RUM);
- Image optimization via TinyPNG , minification , and browser caching produce the fastest performance wins under one hour of work.
