Let’s talk about mainframe monitoring. For decades, mainframes have powered the world’s most critical transactions including banking, insurance, airline reservations, and even government systems. These machines rarely crash, but when they do, people notice immediately. The real problem is that modern IT teams grew up on distributed systems and know Kubernetes monitoring inside out. They understand pods and nodes perfectly well. But mainframes represent a completely different beast entirely. This article walks you through what mainframe monitoring actually means, why it still matters, which tools get the job done right, and how to keep your IBM z/OS environment healthy without losing your sanity.
What Is Mainframe Monitoring
Mainframe monitoring is the practice of collecting, analyzing, and acting on performance data from IBM zSeries or similar enterprise servers. These machines process millions of transactions per second across batch jobs, CICS regions, IMS databases, and DB2 subsystems. Effective monitoring tells you when a job abates unexpectedly, when CPU consumption spikes dangerously, or when an I/O bottleneck begins to form.
Mainframe vs Kubernetes Monitoring
You cannot monitor a mainframe like a cloud native application because the architecture differs fundamentally. There is no kubelet, no kube-proxy, and no container runtime like Docker running on these systems.
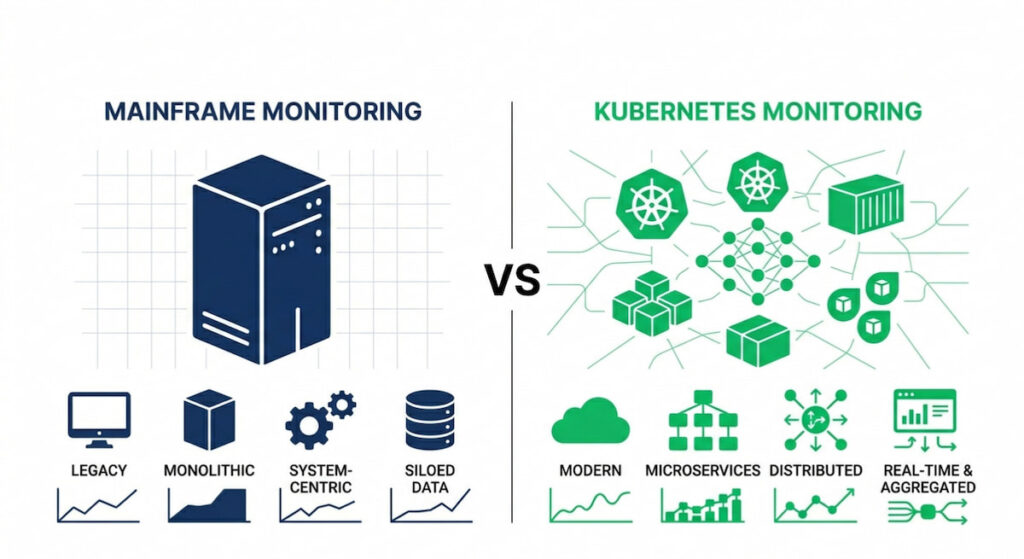
Instead, you have subsystems, address spaces, and VTAM to manage. The learning curve is undeniably steep. But the basics remain universal across both paradigms. You still need metrics, logs, and traces, which modern observability calls the three pillars of system health.
Two Camps of Monitoring Tools
Mainframe monitoring tools fall into two distinct camps. First, you have IBM’s own suite including OMEGAMON, OMEGAMON XE, and IBM Z Monitoring. Second, third party vendor like Monitor Us (a newer player focusing on real time dashboards) offer alternative approaches. Some old school teams still use raw SMF records, which is brutally effective but requires deep expertise.
Why Mainframe Monitoring Matters
Mainframes run the financial backbone of the entire planet, so an unmonitored mainframe is essentially a ticking bomb. One slow I/O operation can delay millions of credit card authorizations across multiple banks. A single hung CICS region might freeze an entire call center for hours.
Outage Prevention
Mainframe outages are statistically rare but catastrophically expensive when they occur. According to the New Relic 2025 Observability Forecast, which surveyed over 1,700 IT professionals across 23 countries, high-impact outages carry a median cost of $2 million per hour (approximately $33,333 per minute), and the annual median cost of high-impact IT outages for businesses surveyed is $76 million per year . Full-stack observability cuts this cost in half, reducing high-impact outages to $1 million per hour.
When a distributed system fails, you typically lose only a few nodes at a time. When a mainframe fails, you lose absolutely everything running on that machine. Good monitoring provides early warnings by detecting rising response times, storage constraints, or lock contention before any user starts screaming.
Compliance and Auditing
Compliance requirements give you another strong reason to monitor these systems properly. Banks and insurers need comprehensive audit trails for regulators. Monitoring tools log every access attempt, every job submission, and every resource allocation automatically. Without those logs, regulators start asking very uncomfortable questions during audits.
Cost Control Through Visibility
Cost management matters enormously on mainframe platforms because they are expensive to run. You pay directly for MIPS (millions of instructions per second) consumed. If a runaway transaction consumes extra CPU cycles, that waste hits your monthly bill immediately. Monitoring identifies that waste clearly and shows you which workloads are inefficient. You can then tune those workloads or move them to cheaper platforms altogether.
Hybrid Cloud Integration
Mainframe monitoring connects naturally to modern DevOps pipelines as well. Teams using hybrid cloud or multi-cloud strategies still rely heavily on mainframe data. They pull metrics into Prometheus or OpenTelemetry collectors regularly. According to Broadcom’s z/IRIS documentation, the OpenTelemetry Collector can be configured with OTLP receivers (using either GRPC on port 4317 or HTTP on port 4318) to receive mainframe traces, with processors for batching (e.g., timeout: 10s) and exporters to backends like Jaeger or New Relic. The mainframe becomes just another data source in their observability stack, though a critically important one.
Key Mainframe Performance Metrics
You cannot monitor what you do not measure, so knowing the right metrics matters tremendously. Mainframe performance metrics differ substantially from what you would track in Kubernetes. Forget about kube-state-metrics or Kubernetes metrics server for this environment. Here is what actually deserves your attention.
System Level Metrics
- CPU utilization: Mainframes use specialty engines including zIIP and zAAP processors. You need to monitor both general purpose CPs and offload engines separately;
- Memory usage:– Paging activity kills mainframe performance faster than almost anything else. Watch carefully for high page rates;
- I/O rates:– Slow DASD or tape drives create backlogs that ripple through every subsystem;
- Storage fragmentation: Mainframes use 31 bit and 64 bit storage addressing. Fragmentation causes allocation failures that stop jobs dead.
Workload and Transaction Metrics
- Transaction response times (CICS, IMS, TSO) – End users feel these delays directly in their workflows;
- Batch job duration and abend rates – Long running jobs delay every downstream process that depends on their output;
- WLM service class performance – Workload Manager assigns performance goals to different work types. Missed goals mean real trouble for your service levels;
- SMF record volume – System Management Facilities generate constant logs. Too many SMF records can fill up available storage quickly.
Resource Utilization and MSU
Resource utilization covering CPU, memory, and storage remains the holy trinity of infrastructure monitoring. But on mainframes, you also track MSU (Million Service Units) as a key metric. That is IBM’s somewhat peculiar pricing metric for software licensing. Higher MSU consumption directly means higher software licensing costs each month.
Anomaly Detection on Mainframes
Anomaly detection works quite differently in mainframe environments compared to cloud native stacks. Simple threshold alerts catch many common issues effectively. But mainframe workloads follow predictable daily, monthly, and quarterly business patterns. A spike on payroll day might be completely normal while the same spike on a Sunday indicates a real problem. Machine learning tools like IBM’s Watson AIOps learn these business cycles automatically. They reduce false alarms substantially over time.
Common Mainframe Monitoring Challenges
Monitoring a mainframe is not like monitoring Kubernetes in any simple way. In K8s, you have a control plane with components like kube-apiserver, etcd, kube-scheduler, and kube-controller-manager. You also have a cloud-controller-manager for AWS, Google, or Azure integrations.
The entire architecture is modular by design. If something breaks, you simply replace a pod or redeploy a container. Mainframes are fundamentally monolithic instead. One misconfigured system parameter affects absolutely everything running on the machine.
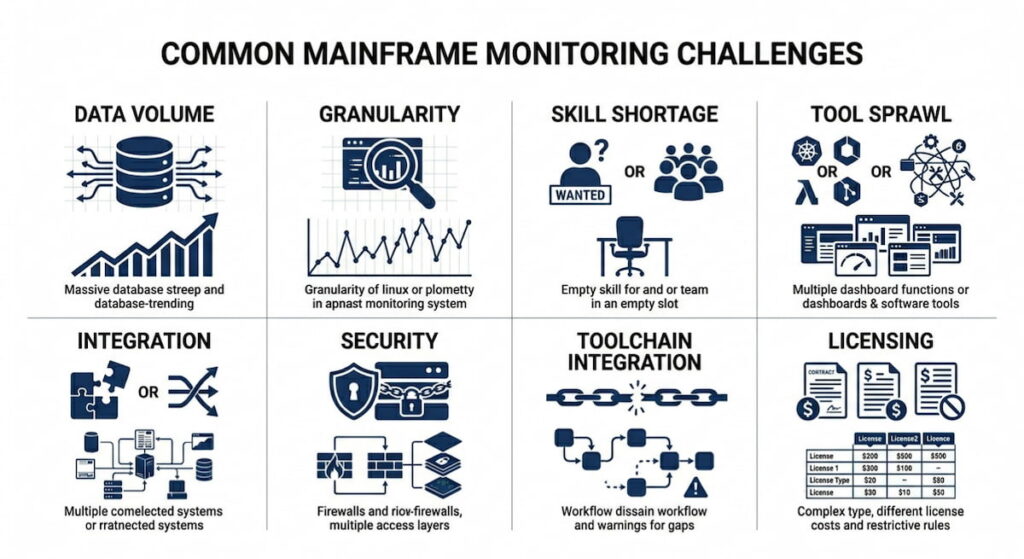
Data Volume and Granularity
A busy mainframe generates terabytes of SMF data every single day. Parsing that volume in real time requires serious computational horsepower that many teams lack. Many organizations sample or summarize their data, which inevitably loses important granularity.
Skill Shortage in the Industry
Young engineers coming out of school know container orchestration and namespaces extremely well. They understand deployments and ReplicaSet thoroughly. But they do not know JCL, VTAM, or z/OS console commands at all. Finding mainframe talent in today’s market is hard and expensive for most organizations.
Tool Sprawl and Integration Problems
You might use IBM Tivoli for mainframe monitoring plus a third party tool for dashboards plus a separate log analyzer for SMF records. Integration between these tools is often messy and incomplete. Data silos form naturally when each tool stores its own copy of information.
Security and Access Control Complexity
Mainframes enforce extremely strict RBAC (Role Based Access Control) for good security reasons. Giving a monitoring tool enough access to collect metrics without over permissioning that tool is genuinely tricky. Some security teams lock down access so hard that the monitoring agent cannot collect necessary metrics at all.
Modern Toolchain Integration Difficulties
You want mainframe metrics inside your existing Prometheus or OpenTelemetry pipeline for unified observability. But mainframes do not natively expose Prometheus endpoints like modern applications do. You need exporters or gateways to bridge the gap, and those introduce additional latency and complexity.
Licensing and Hidden Monitoring Costs
The costs go beyond just MIPS consumption for workloads. Monitoring tools themselves carry substantial license fees. Some vendors charge by LPAR, others by engine count, and still others by MSU tier. Your monitoring bill can easily rival your mainframe rental cost if you are not careful.
Top 7 Mainframe Monitoring Tools
No single tool rules this entire market because each organization has different requirements. Your choice depends on your budget, team size, and whether you lean toward IBM native solutions or open source alternatives.
1. IBM OMEGAMON
The old standard that has been around for decades. OMEGAMON XE for z/OS provides deep visibility into CPU, memory, I/O, and all major subsystems. It is undeniably powerful but also quite complex to configure properly. The user interface looks like it survived from the 1990s without major updates. Still, IBM shops trust it because it comes directly from the hardware vendor.
2. BMC MainView
A strong competitor to IBM’s offerings in this space. MainView offers real time dashboards and historical analysis capabilities that many administrators appreciate. It integrates smoothly with BMC’s broader automation tool suite. Many large banks use MainView as their primary monitoring platform.
3. Monitor Us
A newer entrant that focuses on simplicity and modern user interfaces. Provides pre-built dashboards for CICS, DB2, and IMS subsystems out of the box. Supports API access for pulling metrics into Kubernetes monitoring stacks easily. Significantly less expensive than IBM or BMC options for most deployment sizes.
4. ASG GATEWAY
A solid choice for large enterprise environments with multiple mainframes. Handles cross system monitoring across many different mainframes simultaneously. Offers strong reporting features for capacity planning and chargeback.
5. IBM Z Monitoring Suite
IBM’s cloud friendly offering that works well in hybrid environments. Carries the IBM mainframe monitoring tool branding across all components. Includes OMEGAMON plus additional analytics capabilities. Provides better integration with hybrid cloud deployments than the legacy tools.
6. Open Source Options
You can build your own monitoring stack using Prometheus exporters and Grafana dashboards if you have the expertise. There is a community project called zoscb (z/OS Collector for Prometheus) that provides basic functionality. It is rough around the edges but workable for smaller environments. Not recommended for production critical systems unless you have serious in house expertise to maintain it.
7. CNCF Tooling Integration
For teams already invested in CNCF (Cloud Native Computing Foundation) tools, using OpenTelemetry collectors to forward mainframe data works reasonably well. You still need an agent running on the mainframe side to collect and forward metrics. There is no way around that requirement with current technology.
Cost Monitoring for Mainframes
This section matters more than most administrators admit publicly. Mainframe costs spiral upward without constant watching and active management. Monitoring itself is not free, but good cost monitoring pays for itself many times over through optimization.
What Drives Mainframe Costs
- MIPS consumption: Your software licenses from IBM, CA, BMC, and other vendors often tie directly to peak MIPS usage. A one hour spike during month end processing can increase your annual costs dramatically;
- Storage: DASD and tape storage are not cheap compared to cloud object storage. Plus, SMF records themselves eat significant space over time;
- Specialty engines: zIIP processors cost substantially less than general CPs, but you need to configure workloads correctly to use them. Monitoring shows you underutilized zIIPs that represent wasted capacity you already paid for;
- Subsystem licenses: CICS, IMS, and DB2 each have separate pricing models. More regions mean higher monthly bills.
Cost Monitoring Strategy
A good cost monitoring strategy includes several key components. First, track MSU consumption by time of day and workload type to understand your patterns. Second, identify idle or low utilization LPARs and ask whether you can consolidate them. Third, monitor batch windows carefully and ask whether jobs run longer than needed. Optimizing a single poorly written job can save millions of MIPS annually. Fourth, set alerts for abnormal consumption patterns. If a developer accidentally runs a test job in production like volumes, your bill jumps immediately.
Comparing Mainframe Cost Monitoring to Kubernetes
Compare mainframe cost monitoring to Kubernetes for a useful perspective. In K8s, you use tools like Kubecost to track CPU and memory spend per namespace or deployment. On mainframes, you do not have namespaces or pods as abstractions. You have subsystems and user IDs instead. But the underlying principle is identical across both platforms. Assign costs to business units based on their actual consumption. Show developers how their code choices impact the bottom line directly.
Some mainframe monitoring tools include cost analytics features built in. IBM’s Z Cost Analyzer does this well for native IBM shops. Third party tools like Monitor Us also offer cost dashboards with chargeback reporting. Without cost visibility, your mainframe becomes a black hole of IT spending that finance teams will eventually question aggressively.
Mainframe Monitoring Best Practices
You want actionable advice that works in real world environments. Here is what experienced mainframe teams actually do.
Start with Business Priorities
Start with the business outcomes you need to protect. What transactions matter most to your revenue or customer satisfaction? Monitor those workloads first before anything else. Do not try to collect every possible metric from day one because that approach always fails.
Leverage WLM Goal Mode
Use WLM goal mode as your primary management tool. Workload Manager is your best friend on z/OS systems. Define service classes clearly, set realistic response time goals, and let WLM prioritize automatically. Monitor whether goals are being met consistently. If goals are missed, find and fix the bottleneck causing the problem.
Build Layered Monitoring
Implement layered monitoring that covers multiple levels of the stack. Collect system level metrics for CPU, memory, and I/O across all LPARs. Add subsystem level metrics for CICS, DB2, and IMS regions. Finally, add transaction level metrics for response times. Each layer tells a different part of the story, and you need all three layers to see the complete picture.
Integrate with Existing Observability
Integrate with your existing observability stack rather than building something separate. If you already use Prometheus for Kubernetes monitoring, extend that same system. Deploy a DaemonSet equivalent (not literally since mainframes do not have DaemonSets) but an equivalent collector on the mainframe side. Forward metrics to the same Prometheus instance your cloud teams already use. Use Grafana for unified dashboards across both environments.
Automate Anomaly Detection
Automate anomaly detection instead of relying on manual threshold tuning. Manual approaches inevitably fail as workloads change over time. Use statistical process control or machine learning based detection. IBM’s Z Anomaly Analytics works well for many shops. So do custom solutions using OpenTelemetry and Prometheus alert rules with proper baselining.
Secure the Monitoring Pipeline
Secure your monitoring pipeline just like you secure production systems. Use RBAC to limit who can see mainframe metrics and who can acknowledge alerts. Log all access to monitoring data for audit purposes. Monitor the monitoring system itself as a critical production component.
Test Alerts Regularly
Test your alerts on a regular schedule, not just when you first set them up. Simulate a high CPU condition during a maintenance window. Does the alert fire correctly? Does it reach the on call engineer through your paging system? Many mainframe teams skip this testing entirely, which is a dangerous mistake.
Establish Baselines
Document your normal baseline performance patterns for every workload. Mainframes are remarkably stable machines with predictable usage patterns. Monday at 2 AM looks completely different from Friday at 2 PM in most shops. Know your normal patterns thoroughly because that is how you spot real anomalies when they appear.
Correlate Logs and Metrics
Do not forget about logs even when you have good metrics coverage. SMF records contain forensic gold that metrics alone cannot provide. Parse them with tools like Splunk or the ELK stack regularly. Correlate log events with metric spikes during incident investigations. That correlation is how you find real root causes instead of just symptoms.
Cross Train Teams
Train your Kubernetes people on mainframe concepts and vice versa. Cross training pays enormous dividends during incidents. The engineer who knows kube-scheduler and etcd can absolutely learn WLM concepts with proper training. The DevOps person familiar with cloud native applications can understand batch scheduling principles quickly. Build bridges between your siloed teams.
Plan for Hybrid and Multi Cloud
Plan for hybrid operations because most mainframe shops are adding cloud workloads constantly. Your monitoring must span both environments seamlessly. Use OpenTelemetry to unify telemetry collection across platforms. Send mainframe data to the same backend as your AWS, Azure, or Google Cloud resources.
Review Tooling Annually
Review your tooling choices every year without fail. The mainframe monitoring market changes as new vendors enter and old vendors update their offerings. What worked perfectly five years ago might be overpriced or underfeatured today. Test Monitor Us against your current vendor during each review cycle. Get competitive bids to keep your existing vendor honest on pricing.
Use Real Time Dashboards
Implement real time dashboards for your operations team. Do not wait for daily reports that arrive after the damage is done. Use tools that update every second or faster. Put a Kubernetes dashboard style interface on your mainframe data. Your operators will thank you when they can see problems developing in real time.
Set Up Heartbeat Monitoring
Monitor the monitoring system itself as a critical dependency. If your monitoring agent crashes silently, you will not know anything is wrong until a real failure occurs. Set up heartbeat alerts that fire if data stops flowing. Use external probes that check whether the monitoring system is still responding.
Maintain a Runbook
Keep a living runbook that documents every alert in your environment. What does each alert actually mean in business terms? Who fixes it when it fires? How exactly do they fix it? Update the runbook quarterly as your environment changes. New team members depend on this documentation heavily during their onboarding.
Simplify Everything
Simplify your monitoring approach constantly. Too many mainframe teams monitor by collecting five hundred metrics and only looking at five of them. Pick twenty key indicators that truly matter to your business outcomes. Master those twenty indicators completely. Add more metrics only when a specific need arises, not just because you can.
Mainframe monitoring is not glamorous work that gets you speaking slots at KubeCon. But it keeps the global economy running every single day. The best tools blend IBM’s legacy strengths with modern observability approaches. The best practices respect the platform’s unique constraints while learning from Kubernetes, Prometheus, and OpenTelemetry. Start small with the metrics that hurt most when missing. Monitor what actually breaks in your environment. Then expand coverage gradually. Your future self and your company’s bank account will both thank you for the effort.
