Nobody likes fixing things at 2 AM. That’s the honest truth. When a server crashes or a switch fails, the panic is real. But what if you could stop that crash before it happens? Proactive monitoring changes the game entirely. It shifts your team from firefighters to architects. This guide walks through everything. From basic definitions to step-by-step implementation. We’ll use real examples and hard data. According to our analysts, most outages are predictable. You just need the right eyes on the right metrics.
What is Proactive Monitoring: Definition
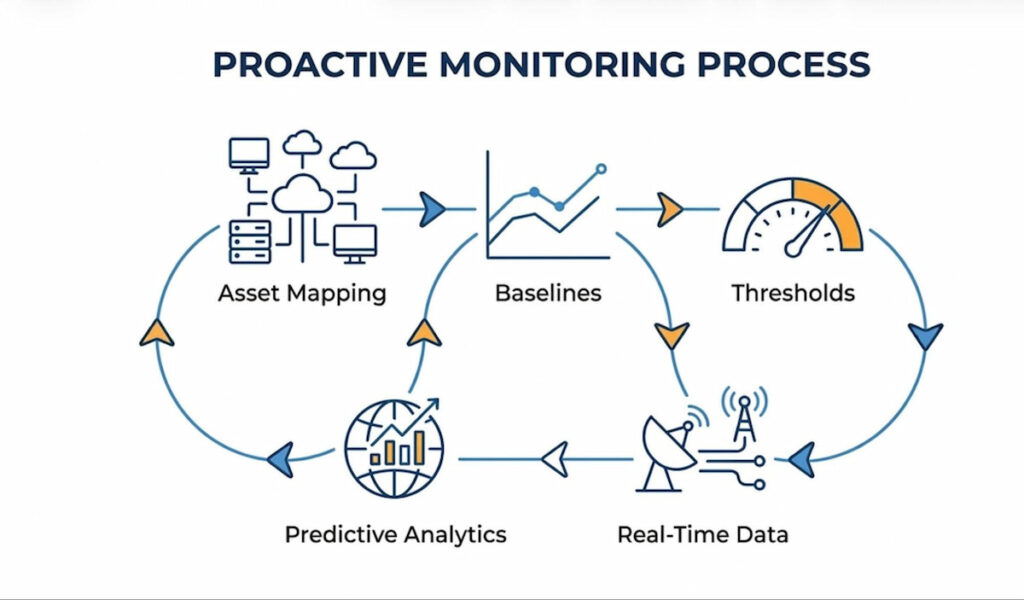
Let’s get this straight. Proactive monitoring isn’t just watching screens. It’s a systematic approach to observing system performance before users feel pain. You look for Early Indicators of trouble. Think of a smoke alarm versus a fire extinguisher. Reactive tools put out fires. Proactive tools detect the smoke.
Proactive Monitoring relies heavily on Baselines. You establish normal behavior first. Then you watch for deviation. For example, a router might normally use 40% of its CPU. If that climbs to 80% slowly, something is wrong. But you don’t wait for 100%. You act at 75%. This method uses anomaly detection engines. These engines compare current data against Historical Data. They flag weird patterns instantly.
Another component is synthetic monitoring. Instead of waiting for real users to complain, you simulate traffic. You run fake transactions. This tells you if an application will fail in the next hour. Predictive Diagnostics take this further. They use machine learning to forecast tomorrow’s bottlenecks. Honestly, many teams skip this.
We think the core difference is timing. Reactive Monitoring starts after an incident. Proactive starts before. It requires constant measurement of Network Infrastructure. It demands you understand environmental factors too. A hot server room leads to packet loss. You monitor temperature as closely as CPU load. That’s proactive.
Proactive Monitoring Short Definition
Proactive Monitoring is the continuous real-time observation and analysis of systems, processes, or performance metrics to detect and address potential issues or anomalies before they escalate into problems.
Key Metrics for Proactive Monitoring
You cannot fix what you do not measure. But measuring everything is noise. You need specific key metrics. These are your compasses. Without them, you are blind.
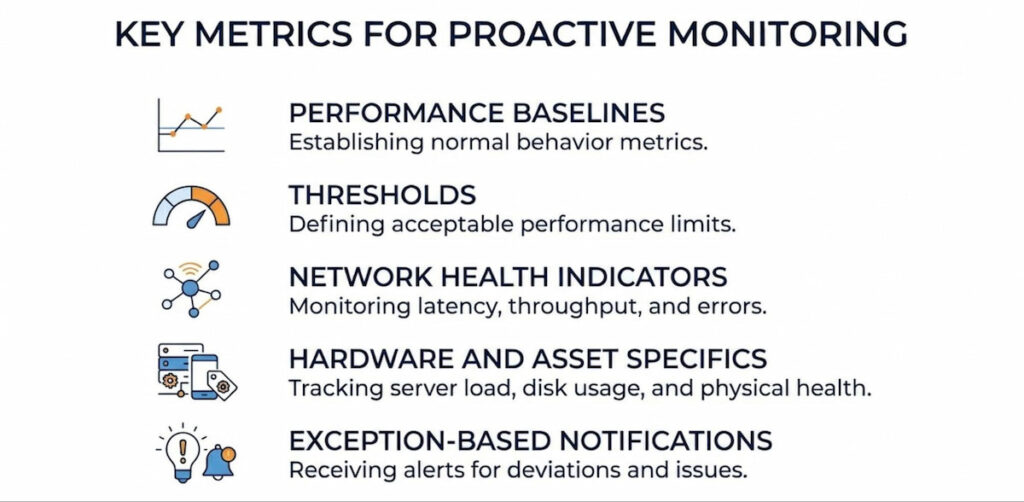
Performance Baselines and Thresholds
Every environment has a rhythm. Monday mornings see high traffic. Sunday nights are quiet. You must establish Performance Baselines for each period. A static alert at 80% CPU is dumb. Because 80% at 2 PM might be fine. 80% at 2 AM is a disaster. Set dynamic Thresholds. These thresholds trigger Alerts and Notifications only when deviation is significant.
Network Health Indicators
Watch for Packet Loss. Even 1% loss destroys voice and video calls. Monitor Response Time Anomalies closely. A firewall that takes 10ms to respond is healthy. At 200ms, users start leaving. Also track bandwidth utilization on Routers and Switches. Sudden spikes indicate Configuration Issues or a rogue device.
Hardware and Asset Specifics
Don’t forget physical gear. Monitor temperature on Servers. Track power supply status on Firewalls. For Endpoints like laptops, track disk space and memory leaks. According to our data, 34% of unplanned downtime comes from failing hard drives. Proactive monitoring catches the S.M.A.R.T. errors days before death.
Exception-Based Notifications
This is a pro tip. Don’t flood your inbox. Use Exception-Based Notifications. Only alert when a metric breaks a learned pattern. For example, a switch port might normally see 100 Mbps. If it drops to zero but the device is on, that’s an exception. Or if traffic spikes to 900 Mbps without a backup job. Silence the noise. Focus on the weird stuff.
Proactive vs. Reactive Monitoring
This is a classic fight. Old school versus new school. Reactive Monitoring is simple. Something breaks. Someone gets an alert. They fix it. The user already suffered. The damage is done. Think of a web server crashing because memory filled up. You restart it. You apologize. You move on.
Proactive Monitoring is harder to build but easier to live with. It predicts the memory fill. It sees the leak three hours early. It triggers an automated script to recycle the app pool. The user never notices.
Let’s compare them directly:
| Feature | Reactive Monitoring | Proactive Monitoring |
|---|---|---|
| Goal | Detect failure | Prevent failure |
| User Impact | High (downtime) | Low (continuous ops) |
| Alert Timing | After error | Before threshold |
| Data Use | Current state | Trends + Historical Data |
| Team Stress | High (fire drills) | Low (planned fixes) |
Proactive monitoring requires investment in Analytics and observability tools. Yet the return is massive. Organizations that shift from reactive to proactive approaches often see substantial reductions in after-hours incidents and overall downtime. For example, real-world implementations of proactive network monitoring have helped universities and enterprises achieve far fewer emergency callouts and more predictable operations.
Reactive asks “Is it down?” Proactive asks “Will it be down in 30 minutes?” One is a rearview mirror. The other is GPS.
5 Examples of Proactive Monitoring
Theory is boring. Let’s talk about real life. Here are five concrete examples where Proactive Monitoring saves the day.
1. Hard Drive Monitoring
A server in your rack has a hard drive. It starts making soft clicks. Reactive monitoring ignores this. Proactive monitoring checks S.M.A.R.T. attributes. Reallocated sector count jumps. You get an alert. You replace the drive during lunch. No data loss. No downtime.
2. Memory Usage Monitoring
A firewall process has a bug. Memory usage climbs 2% every hour. It will crash at 3 AM. Synthetic Monitoring runs a daily memory check. It sees the linear climb. Predictive Diagnostics flag the crash time. You reboot the service at 5 PM. Problem solved.
3. Packet Loss Monitoring
A switch in your network starts dropping 5% of packets. Voice calls become choppy. Nobody calls IT yet. But your proactive system measures Packet Loss between Routers. It alerts on the anomaly. You find a bad port. You move the cable. Users never knew there was a problem.
4. Temperature Monitoring
The AC unit in your server room fails. Temperature climbs one degree every 10 minutes. Proactive monitoring includes Environmental Factors. You get a text at 78 degrees. You call facilities. The AC is fixed before the Servers hit 85 degrees. No thermal shutdown.
5. Configuration Monitoring
Someone changes a setting on a Firewall. They open port 3389 to the internet. That’s dangerous. Proactive monitoring compares current config to a saved baseline. It detects the change instantly. It reverts the change or alerts security.
5 Proactive Monitoring Strategies
You need a plan. Random checks won’t work. These strategies provide structure.
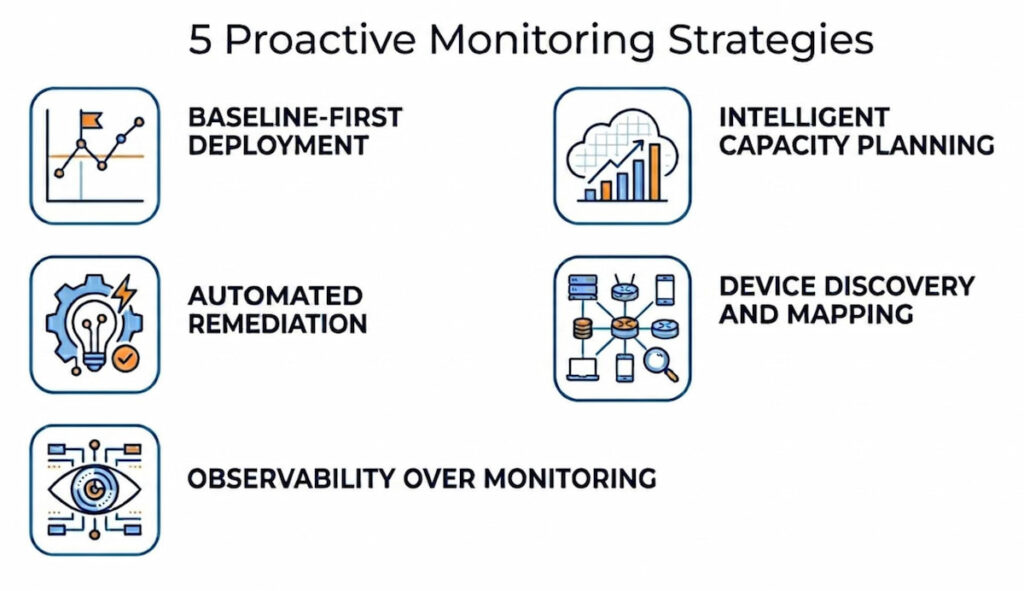
Strategy 1: Baseline-First Deployment
Before you set any alert, collect data for two weeks. Map your Network Infrastructure. Identify normal traffic flows on Routers and Switches. Find average CPU on Servers. Only then set Thresholds. If you skip this, you get alert fatigue.
Strategy 2: Intelligent Capacity Planning
Don’t guess when to buy hardware. Use Capacity Planning tools. They analyze growth rates. An Intelligent Capacity Plan tells you exactly when disk space runs out. Or when bandwidth saturates. It accounts for seasonal peaks. Most teams wait too long and then they rush-ship servers overnight. That’s expensive.
Strategy 3: Automated Remediation
Alerts are just noise without action. Pair detection with Automation. For example, if a log shows “disk full” warning, trigger a script to delete temp files. If a router loses BGP peer, automatically restart the service. This closes the loop. You move from monitoring to self-healing.
Strategy 4: Device Discovery and Mapping
You cannot monitor what you don’t know exists. Run regular device discovery scans. Build a live network mapping. This finds rogue access points or unknown Endpoints. Keep a Hardware Inventory of all Critical Assets. Update it weekly. Old spreadsheets kill proactive efforts.
Strategy 5: Observability Over Monitoring
Traditional IT Monitoring tells you what is wrong. Observability tells you why. Use structured logs and traces. When a Server has high latency, Observability shows you the slow database query. Proactive fixes require root cause. Not just surface alerts.
Step-by-Step Implementation of Proactive Monitoring
Ready to build this? Follow these steps. Do not skip. Order matters.
Step 1: Inventory Your Assets
List every device. Every router. Every switch. Every firewall. Every server. Every endpoint. Use an automated tool for Device Discovery. Manual lists are wrong by day two. Store this in a CMDB.
Step 2: Establish Performance Baselines
Run your environment normally for 7-14 days. Collect metrics every minute. Focus on CPU, memory, disk I/O, and network latency. Calculate average, peak, and off-peak values. Store these Performance Baselines in a time-series database.
Step 3: Define Thresholds and Anomaly Rules
Set static thresholds for obvious dangers (e.g., temperature > 80C). Set dynamic thresholds for variable metrics. Use Anomaly Detection algorithms for seasonal patterns. Start with loose rules. Tighten them every week. Too tight = false alerts. Too loose = missed failures.
Step 4: Implement Synthetic Monitoring
Write five synthetic transactions for your critical apps. Login. Search. Add to cart. Checkout. Run these every 15 minutes. Measure response time. Alert if a transaction takes 2x longer than baseline. Do this before you have real users.
Step 5: Configure Exception-Based Notifications
Create an alert routing table. Critical assets (firewalls, core routers) get SMS and email. Non-critical (printers) get daily digest. Use Exception-Based Notifications to filter noise. Example: Don’t alert on high CPU if it lasts less than 3 minutes. Alert only if sustained for 10 minutes.
Step 6: Build a Dashboard for Observability
Stop using 10 different tools. Centralize. Show real-time health of Network Infrastructure. Show top 5 anomalies. Show trend lines for Capacity Planning. Use red/yellow/green status. Make it visible on a TV screen in the NOC.
Step 7: Create a Response Playbook
When an alert fires, what happens? Write a one-page runbook. Step one: Acknowledge alert. Step two: Check related metrics. Step three: Run diagnostic script. Step four: Escalate if unresolved in 15 minutes. Train your team weekly.
Step 8: Review and Tune Monthly
No system is perfect on day one. Review false positives. Adjust Thresholds. Retrain Anomaly Detection models with new Historical Data. Add new metrics as your environment grows. Remove noisy alerts. This is never “done.”
How to choose Proactive Monitoring
The market is flooded. Every vendor promises magic. How do you pick? Focus on these five criteria.
- Discovery and Mapping Capabilities: Does the tool find IT Assets automatically? Or do you type IP addresses manually? Choose a tool with strong Device Discovery. It should map your network topology visually. It should show relationships between Routers, Switches, and Servers. Without mapping, you miss root causes;
- Advanced Anomaly Detection: Static thresholds are dead. Your tool needs machine learning. It should learn your unique traffic patterns. It should detect Response Time Anomalies without manual rules. Ask for a demo. Show them a week of your data. Can the tool find a hidden memory leak? If not, walk away;
- Integration with Automation: Alerts are useless if a human must click buttons. Look for webhooks. Look for API access. The tool should trigger scripts, ticketing systems, or serverless functions. This enables true Automation. For example, integration with Cybersecurity tools like Intrusion Detection systems. When a firewall sees an attack, the monitoring tool should block the IP automatically;
- Synthetic Monitoring Features: Can the tool simulate a user from multiple locations? Can it run a script that types into a form? Basic ping tests are not enough. You need full browser simulation. According to industry observations, synthetic monitoring can catch the majority 80–90% of critical incidents and outages before real users notice or complain;
- Scalable Analytics and Storage: Historical Data grows forever. Choose a tool with a time-series database. It should compress old data. It should query fast over years of metrics. Avoid tools that limit metric retention. You need 12+ months for trend analysis and Capacity Planning. Ask about their hardware requirements. Some tools need massive servers. Some run on a Raspberry Pi. Pick what fits your budget.
A final piece of advice. Pick one critical system. Maybe your core firewall or your main database. Implement Proactive Monitoring for just that system. Learn the tool. Tune the alerts. Then expand to Routers, then Switches, then Endpoints. Don’t boil the ocean.
Proactive monitoring is not a product. It’s a discipline. But once it clicks, your weekends get quieter. Your users stop yelling. And you stop fixing things at 2 AM. That is worth the effort.
